April 08, 2019 • Yellowstone’s thermal areas are the surface expression of the deeper magmatic system, and they are always changing. They heat up, they cool down, and they can move around. A recent spectacular example was the September 2018 emergence of a new thermal feature and eruption of the long-dormant Ear Spring in the Upper Geyser Basin, near Old Faithful. Even more impressive was the expansion of heated ground in the Back Basin of the Norris Geyser Basin in 2003. These sorts of changes are part of the normal life cycles of thermal areas in Yellowstone National Park.
Recently, we have discovered another phenomenal example of thermal change—the emergence of an entirely new thermal area, which has taken place over the past 20 years.
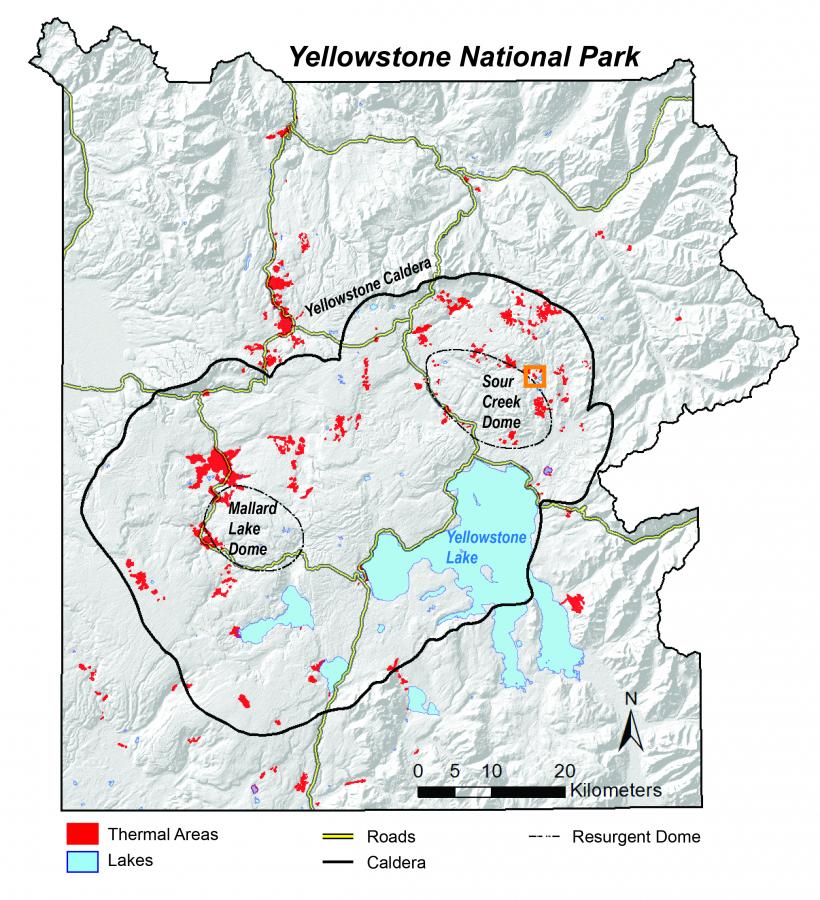
First, a little background. A thermal area is a contiguous geologic unit that includes one or more thermal features (like fumaroles, hot springs, or geysers) surrounded by hydrothermally altered ground, hydrothermal mineral deposits, geothermal gas emissions, heated ground, and/or a lack of vegetation. There are more than 10,000 thermal features in Yellowstone, most of which are clustered together into about 120 distinct thermal areas (like Upper Geyser Basin and Norris Geyser Basin). One such area is called the Tern Lake thermal area and is located in the central part of the Park along the northeast margin of the Sour Creek resurgent dome. It is named after nearby Tern Lake and West Tern Lake. This area is deep in Yellowstone’s back county, about half a mile (0.8 kilometers) from the nearest trail, and about 11.2 miles (18 kilometers) from the nearest trailhead; therefore, few people have visited this site. Indeed, many of Yellowstone’s thermal areas are located in remote and inaccessible areas of the Park. This is why YVO scientists use satellite-based thermal infrared remote sensing to help map the locations of thermal areas and their changes through time.


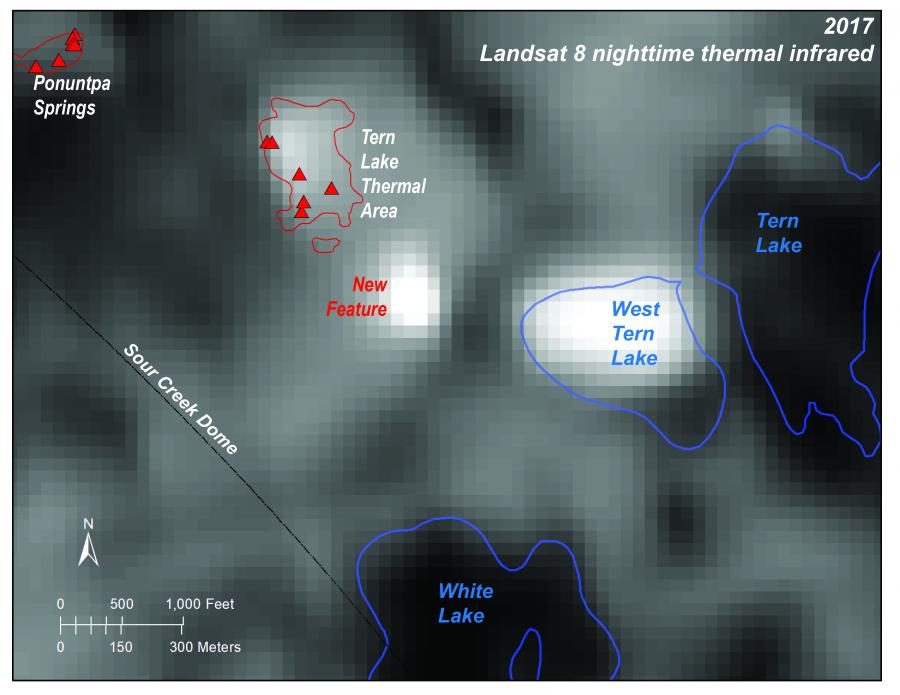
Landsat-8 nighttime thermal infrared image from April 2017 showing the Tern Lake area. In Yellowstone, temperatures are extremely cold at night in the winter, and most lakes are frozen (dark pixels).
West Tern Lake seems to be thawing here – perhaps it receives some thermal waters from nearby hot springs. The patch of bright (warm) pixels between West Tern Lake and the Tern Lake thermal area has emerged over the last 20 years. Lakes are outlined in blue; the boundary of the Sour Creek resurgent dome is in black; known thermal areas are outlined in red; and the red triangles are individual thermal features that have been mapped. Image credit: USGS[/caption]Landsat 8 nighttime thermal infrared image from April 2017 showing the Tern Lake area. In Yellowstone, temperatures are extremely cold at night in the winter, and most lakes are frozen (dark pixels). West Tern Lake seems to be thawing here – perhaps it receives some thermal waters from nearby hot springs. The patch of bright (warm) pixels between West Tern Lake and the Tern Lake thermal area has emerged over the last 20 years. Lakes are outlined in blue; the boundary of the Sour Creek resurgent dome is in black; known thermal areas are outlined in red; and the red triangles are individual thermal features that have been mapped.
Landsat 8 thermal infrared images are a great resource for examining thermal areas—especially when the temperature-sensitive images are acquired at night when the contrast between thermal areas and unheated ground is highest. Analysis of a Landsat-8 nighttime thermal infrared image acquired in April 2017 revealed an unexpected warm area between West Tern Lake and the previously mapped Tern Lake thermal area. This mysterious patch of bright pixels in the thermal infrared image did not match any previously mapped thermal areas. Could it be a lake? At night, lakes are warmer than the surrounding land and stand out in thermal infrared images, but only if they are liquid (i.e., not frozen).
All of Yellowstone’s lakes without significant thermal input stay frozen throughout the winter, but the lakes can start to thaw in April. In fact, this appears to be the case in the April 2017 image—some of the lakes are clearly frozen (dark pixels in the thermal infrared), but West Tern Lake appeared to be starting to thaw. This may have been because the lake was receiving thermal water from nearby hot springs. But that new bright area between West Tern Lake and the previously mapped Tern Lake thermal area was not a lake. What was it? High-resolution airborne visible images held the answer.
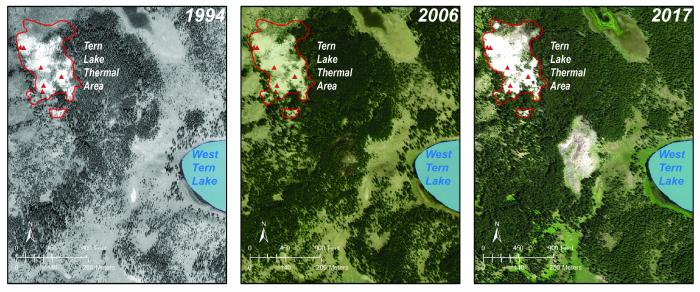
The National Agriculture Imagery Program (NAIP), administered by USDA’s Farm Service Agency, acquires high-resolution (0.5 to 1-m pixel) aerial imagery over the continental U.S. every few years. The most recent image of the Tern Lake region, from 2017, reveals a large area of dead trees and bright soil, rather like a thermal area. The NAIP imagery from 2006 shows a smaller zone barren of vegetation and the beginnings of a tree kill zone with many reddish-brown trees among healthy green ones. The 1994 air photos, while black and white and lower spatial resolution, clearly show that this was once an area of healthy trees with no hint of a thermal area. Other historical imagery that have been analyzed indicate that this thermal area started forming in the late 1990s or early 2000s. It is also notable that between 2006 and 2017 there was an increase in the size of the tree kill zone on the north side of the previously mapped Tern Lake thermal area.

From all these satellite and aerial images, we conclude that a new thermal area has emerged in the past 20 years! The newly emerging thermal area, located at 44.6635° N latitude, 110.279° W longitude, can be seen using Google Earth. In fact, using the time slider tool in Google Earth, one can see how this area has changed since 1994—you can see the changes in the vegetation and the emergence of the thermal area yourself!
The recognition of the new thermal area is a great example of the importance of satellite thermal infrared imaging—especially images acquired at night—for mapping Yellowstone’s thermal areas (including both the discovery of new hot spots and changes in existing areas). This is exactly the sort of behavior we expect from Yellowstone’s dynamic hydrothermal activity, and it highlights that changes are always taking place, sometimes in remote and generally inaccessible areas of the park. We will continue to keep an eye on Yellowstone using satellite imagery and report on any changes we see in future Caldera Chronicles articles. And if you’re really interested, you can check out the Landsat-8 data and airborne NAIP images for yourself! All images are freely available from https://earthexplorer.usgs.gov. Have fun!


