
Source: ESA
When we think of climate change, one of the first things to come to mind is melting polar ice. However, ice loss isn’t just restricted to the polar regions. According to research published today, glaciers around the world have lost well over 9,000 gigatons (nine trillion tons) of ice since 1961, raising sea level by 27 mm.
An international team led by the University of Zurich in Switzerland used classical glaciological field observations combined with a wealth of information from various satellite missions to painstakingly calculate how much ice has been lost or gained by 19 different glacierized regions around the world.
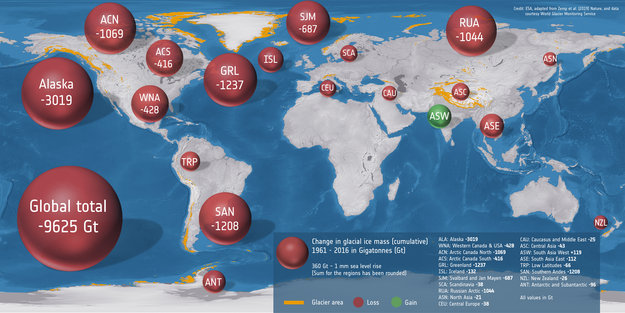
Their research, published in Nature, reveals that glaciers lost 9,625 gigatons of ice between 1961 and 2016.
The largest regional losses were in Alaska, followed by glaciers around the edge of the Greenland ice sheet and from glaciers in the southern Andes. Significant amounts of ice were also lost from glaciers in the Canadian and Russian Arctic, as well as from Svalbard.
Glaciers in temperate regions such as in the European Alps and the Caucasus mountain range did not escape ice loss either, but are too small to make a significant contribution to sea level.
Interestingly, the only area to have gained ice over the 55-year period was southwest Asia (noted on the map as ASW). Here, glaciers amassed 119 gigatons of ice, but neighboring southeast Asia (ASE) lost around the same amount, 112 gigatons.
ESA’s Climate Change Initiative – a research program focused on generating global datasets for the key components of Earth’s climate, known as essential climate variables – was also key to the research.
The initiative’s glacier project, together with ESA’s former GlobGlacier project, provided glacier outlines and information on ice mass changes for thousands of individual glaciers.
Frank Paul, co-author of the study explains, “Glacier outlines are needed to make precise calculations for the areas in question. To date, this information came largely from the U.S. Landsat satellites, the data from which are delivered to European users under ESA’s Third Party mission agreement.
“In the future, the Copernicus Sentinel-2 mission, in particular, will increasingly contribute to the precise monitoring of glacier change.”
Digital elevation models, which provide topographic details of a region, were calculated using information from the Japan Aerospace Exploration Agency’s ASTER sensor on the U.S. Terra mission and Germany’s TanDEM-X mission. Both sources were processed within the Glaciers Climate Change Initiative and other projects.
These data, along with the comprehensive glaciological database compiled by the World Glacier Monitoring Service, allowed the researchers to reconstruct ice thickness changes of 19,000 glaciers worldwide.
By combining these measurement methods and having the new comprehensive dataset, the researchers could estimate how much ice was lost each year in all mountain regions since the 1960s.
The glaciological measurements made in the field provided annual fluctuations, while satellite data allowed them to determine ice loss over several years or decades.
Research leader, Michael Zemp, said, “While we can now offer clear information about how much ice each region with glaciers has lost, it is also important to note that the rate of loss has increased significantly over the last 30 years. We are currently losing a total of 335 billion tons of ice a year, corresponding to a rise in sea levels of almost 1 mm per year.”
While warming ocean water still remains the main driver for sea-level rise, melting glacier ice is the second largest contributor to rising seas.
Dr. Zemp added, “In other words, every single year we are losing about three times the volume of all ice stored in the European Alps, and this accounts for around 30% of the current rate of sea-level rise.”
Around the world, vanishing glaciers also ultimately mean less water for millions of people, less hydroelectric power and less water for crops. While melting glaciers also result in sea-level rise, they critically increase the risk of other natural hazards such as glacier-lake outburst floods and related debris flows.
The pace at which glaciers are losing mass in the long term is very important to making informed future adaptation decisions. This kind of information, therefore, is critical for international bodies assessing climate change, such as the Intergovernmental Panel on Climate Change.
Mark Drinkwater, Senior Advisor on cryosphere and climate at ESA, added, “Bearing in mind the socio-economic consequences, the fate of glaciers in a future climate is something ESA views seriously.”
“It is fundamental that we build upon existing monitoring capabilities using observations from the EC’s Copernicus Sentinel missions, and other ESA and Third Party Mission missions. Their data crucially allow us to build a robust climate perspective to reveal regional and year-to-year fluctuations of glaciers and other parts of the cryosphere such as snow cover, sea ice and ice sheets.”
Reference:
Zemp, M., M. Huss, E. Thibert, N. Eckert, R. McNabb, J. Huber, M. Barandun, H. Machguth, S. U. Nussbaumer, I. Gärtner-Roer, L. Thomson, F. Paul, F. Maussion, S. Kutuzov, and J. G. Cogley. 2019. “Global glacier mass changes and their contributions to sea-level rise from 1961 to 2016.” Nature. doi: 10.1038/s41586-019-1071-0.


