Source: NASA Spinoff

It started as an algorithm to detect clouds in satellite imagery, but now the software is being used for everything from increasing food security in the developing world to guiding futures trading on Wall Street.
Satellites like the Landsat series don’t just take pictures of Earth—they’re used to monitor forest and crop health, ice cap and glacier coverage, surface moisture, and a host of other surface conditions. Crucially, however, pixels capturing clouds and their shadows throw off all this data, so those pixels have to be discarded before any calculations are made.
“On a global scale, this is labor intensive, so you’ve got to be able to do it in some sort of automated fashion,” says Tom Stanley, technology transition lead at Stennis Space Center.
Initial plans for the Landsat 8 Earth-imaging satellite didn’t include a thermal sensor, which was how its predecessors had detected cloud cover. Instead, engineers at Stennis put out a Small Business Innovation Research (SBIR) solicitation for software capable of detecting cloud cover, which Stephanie Hulina, then a contractor at Goddard Space Flight Center, cofounded a company to win.
Stanley, who was the contracting officer’s technical representative for the SBIR work at Stennis, notes that Hulina was doing remote sensing and global information systems work at the time. “She was already highly knowledgeable about the Earth Science Program and looking for her niche so she could start her own business.”
Thus, Geospatial Data Analysis (GDA) Corporation of State College, Pennsylvania, was born.
Technology Transfer
Landsat 8 ultimately incorporated a thermal imager and didn’t require the software, but by then Hulina and her company had long moved beyond cloud detection and into broader territory. “A lot of what we were doing for cloud detection was really feature detection, so we just applied it to crops,” she says.
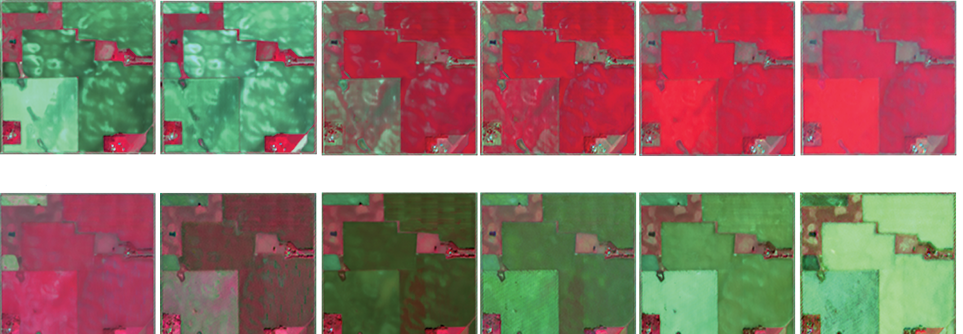
Further SBIR contracts with Stennis in 2004 and 2005 focused on analyzing satellite images in visible and infrared spectra to identify surface features such as crop coverage and health, as well as soil conditions, forest fires, and gypsy moth outbreaks.

“This definitely fits in with the goal of taking NASA science and capabilities and applying those to areas of public need,” Stanley says, noting that the Space Agency has a longstanding interest in monitoring and forecasting conditions on Earth, such as food productivity, climate change, and the impacts of droughts and disasters.
“Certainly, we want to know what the overall agricultural productivity is. And the whole Earth Science Program is focused on Earth dynamics for purposes like ecological forecasting and disaster management.”
Hulina says the SBIR funding from Stennis was crucial in building the company. “It gave us the opportunity to really research and develop what we call scientific-quality algorithms without the pressures of the commercial marketplace.” Clouds are just one type of interference that creates noise in the satellite data, and the company had to develop algorithms not just to identify crop types and health but to correct for factors like topographical effects on lighting or the differences in angles between the center of an image and the edges.
GDA also used the opportunity to automate its systems, which regularly pull, correct, and analyze data from several Earth-imaging instruments, and it built a 200-terabyte cloud to also allow mining of historical and most current crop statistics from various agricultural monitoring entities to answer specific queries with tables, charts, maps, and other products.
“As far as we know, this is the only operational repository of global agricultural statistics and crop-relevant data,” says Dmitry Varlyguin, GDA’s vice president and chief scientist. “The SBIRs gave us time to develop all this and have a long-term plan.”
Benefits
Calculations of crop coverage, type, health, and growth, and especially forecasts of crop productivity interest organizations like the U.S. Department of Agriculture’s (USDA) Foreign Agricultural Service, which provides unbiased commodity estimates and forecasts to create a marketing edge for U.S. producers in world markets.
As GDA amassed enough global crop data to develop commercial products, the agricultural service became its biggest customer, but others, such as agricultural insurance companies, grain and commodity traders, and food transporters, also became clients, Hulina says.
“Anybody who really needs to know where crops are, how they’re progressing through the growing season, and what the output will be” is a potential customer, she adds.
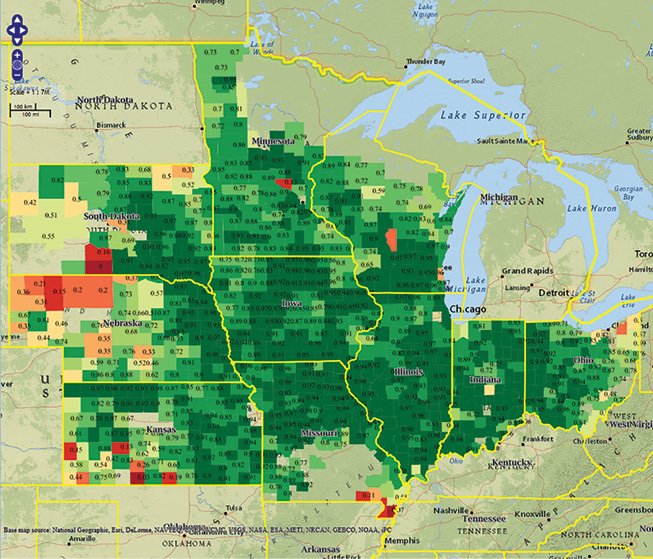
For commercial customers, GDA offers real-time and historical image-based data for 16 major crops around the world. This “agricultural intelligence” includes maps of crop coverage, acreage totals, ground conditions, crop health, and forecasts of yield per acre and overall global production. These can also be broken down to national and state levels.
The system pulls imaging from multiple sensors on several satellites, which vary in resolution, spectral bands, how wide a swath they can see, and how often they pass over a given area, letting the company tailor products to meet a wide range of needs. GDA says it’s the only company to combine all these capabilities on a global scale.
Its relatively new GeoSynergy webGIS service puts them all in one place to let the user manipulate and analyze calibrated, full-resolution current and historical imagery and data. Varlyguin says the company plans to continue adding new capabilities, as well as new sources of imagery as they become available.

The Foreign Agricultural Service uses GDA’s tools, among other sources, to create its monthly production estimates for all major commodity crops, and Hulina notes that crop futures markets move according to those estimates. “We are the only remote sensing firm supplying that line of evidence,” she says.
The estimates also help the service predict shortages to help direct its food aid programs. The company also counts the U.S. Geological Survey (USGS), the U.S. Forest Service, and the USDA’s National Agricultural Statistics Service among its customers.
But the company’s success wouldn’t be possible without two important Government initiatives, Varlyguin says. Earth-imaging analysis on a global scale wouldn’t be feasible without free satellite imagery. Landsat images, for example, cost hundreds to thousands of dollars per scene until the USGS decided in 2008 to make them free. And the SBIR program, he says, “is extremely beneficial, not just to GDA but to overall research and development. Without that, a lot of companies, including GDA, would be very different than they are.”
—–
Addendum, April 9, 2019: The Landsat Science News editor reached out to GDA Corporation’s Vice President and Chief Scientist, Dmitry L. Varlyguin, and asked him to elaborate on the impact of the free and open Landsat data archive for GDA. That Q&A follows:
How would you describe the importance of the free and open Landsat data policy?
GDA heavily relies on free Landsat imagery in our continuous monitoring and analysis of global crops. The company’s success wouldn’t be possible without the USGS making Landsat imagery free and open in 2008. Arguably, the free and open Landsat data policy has also influenced the decision of European Space Agency (ESA) to enable free access to their Sentinel-2 imagery and commercial satellite imagery providers to lower the price of their data. Without the free and open Landsat data policy, a lot of commercial applications wouldn’t be feasible and a lot of commercial companies—including GDA—would be very different than they are.


