Dr. Martin O’Leary is a glaciologist with Wales’ Swansea University. He spends most of his time modeling glacier movements and from time-to-time he uses Landsat data to check things out, to get a lay of the land—or glacier. As a pet project he conceived of @LandsatBot, an automated twitter account that tweets interesting looking Landsat 8 images each hour. We recently spoke with Dr. O’Leary about @LandsatBot.
(Q) How did you conceive of this project?
(A) I’d been playing around with Twitter automation stuff, and was looking for a project. I had also recently seen some stuff like the Libra Landsat browser, so Landsat was in my mind. I guess I just put the two together.
(Q) How does the @LandsatBot pick the images it is going to display?
(A) It picks a random point on the Earth, then does a search for cloud-free (<10% cloud) Landsat 8 images containing that point. It then picks an image at random. There’s also a filter which prevents really boring images—it checks if there’s above a certain level of variability in the pixel values. If any of this fails (no images available, etc), it just tries again until it finds one that works.
(Q) What is the @LandsatBot image tweeting frequency?
(A) Once an hour, on the hour. It sometimes tweets more often if I’m testing things, or less often if it’s crashing because I’ve messed up, but it’s supposed to be once an hour.
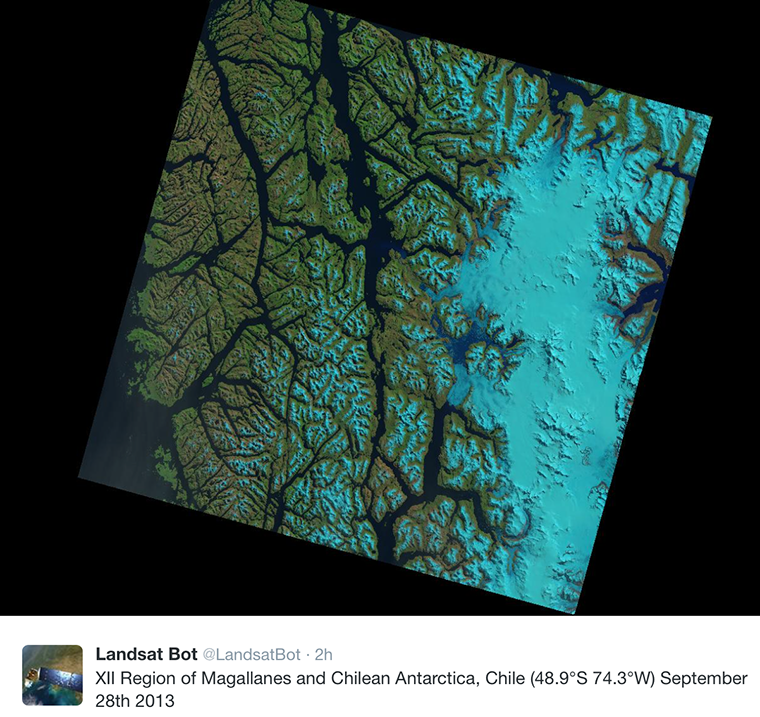
Example @LandsatBot tweet: