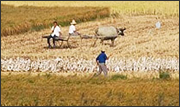
“Harvested rice paddies have become a stage where wild water birds, which naturally carry low pathogenic types of the virus, and domestic ducks mix,” explains Xiao. “In that mixing, virus transmission might occur.” As the virus spreads among species, the possibility for evolution into a highly pathogenic type of flu increases.
Xiao starts his analysis of satellite images by having computers identify areas with a unique seasonal pattern: a period where the satellite sees only water, followed by a mix of water and vegetation, followed by a period where all the satellite sees is vegetation. “This sequence—water, mix, no water—is unique to rice paddies,” explains Xiao.
Xiao currently uses observations from the MODIS sensor on NASA’s Terra satellite for this stage of the analysis because it depends on frequent images of the same area. MODIS provides daily observations of most places on Earth, but the images show only a moderate amount of detail. “In many cases, rice paddies are smaller than the 250-meter pixels in the MODIS images,” explains Xiao, “and we miss them.”
This is where the Global Land Survey 2005 collection will contribute substantially. Xiao and his team are starting to combine radar images from the ALOS/PALSAR mission of Japan with Landsat images from the Global Land Survey to identify and map paddy rice and wetlands with much greater detail than they could before.
“We need that kind of detail to better understand how and when the birds are moving among the different habitats where they can acquire or transmit the H5N1 virus,” says Xiao.
Source: Rebecca Lindsey; NASA Earth Observatory
More information:
+ Earth Observatory article
+ NASA’s Newest Map of the World

A Rendezvous with Landsat
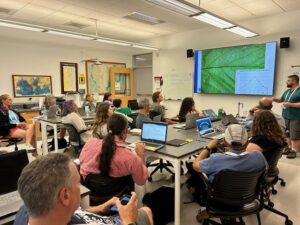
NASA outreach specialists led educators through a workshop on accessing and utilizing Landsat data at the annual Earth Educators’ Rendezvous.


