Source: Nancy Bazilchuk, Norwegian University of Science and Technology
One of the key ways to combat global climate change is to boost the world’s use of renewable energy. But even green energy has its environmental costs. A new approach describes just how hydropower measures up when it comes to land use effects.
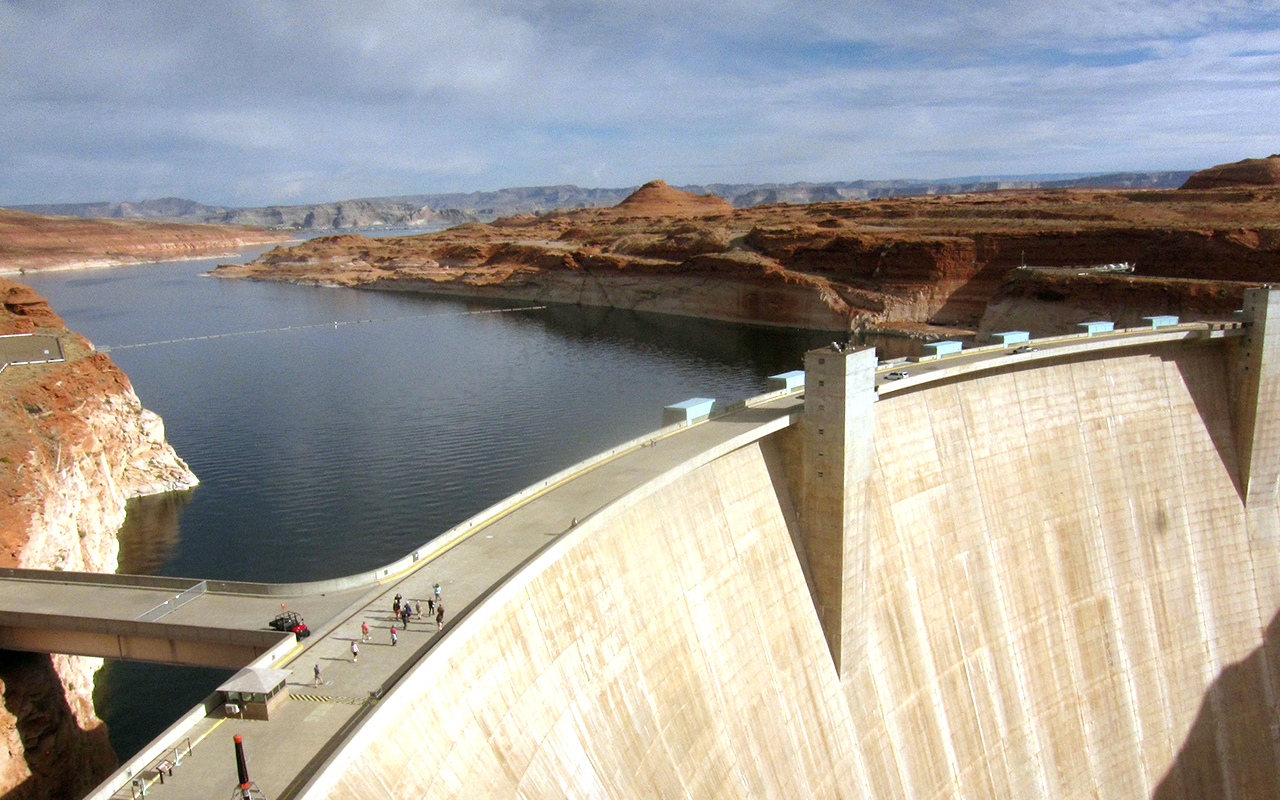
Hydropower is the world’s top provider of renewable energy, producing a whopping 16 percent of the global energy supply. That’s a good thing when it comes to the climate, especially compared to energy from fossil fuels. But hydropower is not without its environmental costs, particularly when it comes to the land that is drowned under reservoirs or gobbled up by roads and power lines built for a hydropower project.
Now, a team of Norwegian-based researchers has developed an innovative way to describe how much land it takes to generate a kilowatt-hour of electricity from hydropower. The goal is to make it easier for policymakers and businesses to assess the environmental trade-offs of current hydropower plants and involved in investing in new hydropower plants.
“Some hydropower reservoirs may look natural at first. However, they are human influenced and if land has been flooded for their creation, this may impact terrestrial ecosystems,” said Martin Dorber, a PhD candidate at the Norwegian University of Science and Technology’s Industrial Ecology Programme.
Life-cycle analysis
There’s widespread agreement that boosting the amount of electricity that the world gets from renewable energy like hydropower is key to combatting global climate change.
The Intergovernmental Panel on Climate Change (IPCC) has looked at this issue in a special report from 2011 on renewable energy sources and climate change. There, the organization says governments and industry need to include the long-term environmental consequences of hydropower into current and future projects. That way, they can identify the environmental trade-offs that will result from expanding hydropower production.
Dorber and his colleagues Francesca Verones from NTNU’s Industrial Ecology Program, and Roel May from the Norwegian Institute for Nature Research realized that they had the perfect tool for quantifying the environmental effects of hydropower production. It’s an analysis tool called Life Cycle Assessment, commonly abbreviated as LCA.
LCA gives researchers a methodology to look at all the environmental impacts of a product or process during its life cycle. That means they start at the very beginning, from the production of the item’s components, to when the product or process is in created and in use, and finally to when it is no longer in use and recycled or otherwise disposed of. The idea is to give a picture of the complete environmental cost of something.
As an example, if you were to conduct a life-cycle assessment of a beer can, you would need to know everything starting with the environmental costs of mining the raw material (bauxite), shipping it to be made into aluminium, the making of the can itself, and what it takes to recycle it after it has been used. It’s complicated, but researchers at NTNU’s Industrial Ecology Programme have perfected this approach for hundreds of different products and processes.
One of the potential environmental effects of hydropower development is what it can do to biodiversity. It can alter freshwater habitat, degrade water quality, and change land use by flooding land for reservoirs, and from the construction of the dam and the power lines and access roads the project needs. The researchers realized that there isn’t enough information available yet to allow LCA to assess all of these impacts from hydropower, so they decided to focus on one key issue: land use and land use change.
“Land use and land use change is a key issue, as it is one of the biggest drivers of biodiversity loss, because it leads to loss and degradation of habitat for many species,” Dorber said.
Flooding natural lakes
The first step for the researchers was to conduct what is called a life cycle inventory, by figuring out just how much land is used to produce a kilowatt-hour of electricity.
Since Norway is one of the top ten hydropower producers in the world, with more than 95 percent of all domestic power production from hydropower, the researchers realized they needed to create an inventory specific to Norway.
There are databases that attempt to provide this information, but the largest of these, called Ecoinvent, only had information on hydropower production for Switzerland and Brazil. And none of the databases accounted for the water area of a natural lake that might have been flooded to make the hydro reservoir, the researchers said.
“Most of the Norwegian hydropower reservoirs are created by impounding natural lakes,” Dorber said. “So if we applied the information from the databases that don’t account for the water area of a natural lake, that would lead to a gross overestimation of the environmental impact.”
The trouble is, there’s minimal information available on the size of the lakes that were inundated to create Norway’s 1289 hydropower reservoirs. So the researchers found a way to estimate what original lake sizes would have been — by using satellite imagery.
How they did it
Fortunately, the researchers had access to two excellent sources of information to make their estimates. The first was measurements of the actual reservoir surface areas at their highest regulated water level, provided by the Norwegian Water Resources and Energy Directorate (NVE).
The second was free, downloadable satellite images from the NASA-USGS Global Land Survey data set, where they used images from 1972-1983 for Norway. The researchers also used aerial photographs as needed from an Internet portal called Norge i Bilder, which provides aerial photographs for Norway as early as 1937.
The dates of the images matter, because the researchers needed to be able to see the land before the hydropower projects were constructed. That meant they could only assess water surface areas before dam construction for hydropower plants built on or after 1937 for the area covered by the aerial photographs, and for dams built on or after 1972 for the area covered by the Landsat photos. As a result, they were only able to calculate how much land was inundated for 184 hydropower reservoirs in total.
For a variety of reasons, they weren’t able to use data for 77 reservoirs that they had land area information for. In the end, they were able to calculate land occupation by reservoirs that provided roughly 20 per cent of the total average annual hydropower electricity produced in Norway between 1981 and 2010.
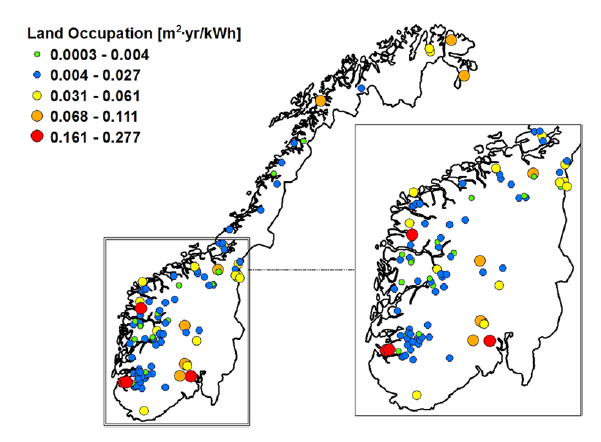
“By dividing the inundated land area with the annual electricity production of each hydropower reservoir, we calculated site-specific net land occupation values for the Life Cycle Inventory,” Dorber said. “ While it’s beyond the scope of this work, our approach is a crucial step towards quantifying impacts of hydropower electricity production on biodiversity for Life Cycle Analysis.”
Other uses, other countries
Dorber points out that their approach could be employed by other countries that wanted to know more about the effects of hydropower on the environment, because the Landsat data covers the entire globe and is freely available.
And when they compared the Norwegian information they generated to the hydropower information they had from Switzerland and Brazil, they saw just how different the effects are in the different countries.
“The average land occupation in our study across all the hydropower plants we looked at is 0.027 m2· yr/kWh and is larger than the existing 0.004 m2· yr/kWh in the database for Switzerland,” Dorber said. “However, when we adjusted the land occupation value to address uncertainties, the adjusted average land occupation (0.007 m2·yr/kWh) is lower than our average land occupation (0.027 m2·yr/kWh) and is thus closer to the existing 0.004 m2·yr/kWh in the Ecoinvent database.”
Knowing how much land was occupied when a dam was built can also help to calculate how much water is lost on average to evaporation, which can affect aquatic ecosystems by reducing the amount of water released from the dam.
And because the creation of hydropower reservoirs leads to an initial increase in greenhouse gas emissions from the decomposition of organic matter that was flooded by the reservoir or flushed into the reservoir, the information can also be used to calculate net water consumption and net greenhouse gas emissions for the Life Cycle Inventory, Dorber said.
“We have shown that remote sensing data can be used to quantify the land use change caused by hydropower reservoirs. At the same time our results show that the land use change differs between hydropower reservoirs,” Dorber said. “Therefore, more reservoir-specific land use change assessment is a key component that is needed to quantify the potential environmental impacts in connection with hydropower reservoirs.”
Reference:
Dorber, Martin, Roel May, and Francesca Verones. 2018. “Modeling Net Land Occupation of Hydropower Reservoirs in Norway for Use in Life Cycle Assessment.” Environmental Science & Technology 52 (4):2375-2384. doi: 10.1021/acs.est.7b05125.