This February marks the 10th anniversary of the launch of Landsat 8, launched by NASA in 2013 and operated by the US Geological Survey. Equipped with its Operational Land Imager (OLI) and Thermal Infrared Sensor (TIRS) onboard instruments, Landsat 8 represented a significant advance in remote sensing technology and was the first to allow everyone in the world fully free and open access to its data from first light.
In celebration of a decade of service, we take a look back at some of the remarkable ways Landsat 8 has fundamentally altered the way we see our world.
Landsat 8: A Decade of Service (script) by Chris Burns
For 50 years, the Landsat mission has kept a watchful eye over earth, providing the longest continuous record of our planet from space and bolstering our understanding of land use, urbanization, climate change and more.
This February marks the 10th anniversary. of the launch of Landsat 8, launched by NASA in 2013 and operated by the U.S. Geological Survey.
Equipped with its Operational Land Imager and Thermal Infrared Sensor instruments, Landsat 8 represented a significant advance in remote sensing technology and was the first to allow everyone in the world fully free and open access to its data from first light.
In celebration of a decade of service, let’s take a look back at some
of the remarkable ways Landsat 8 has fundamentally altered
the way we see our world.
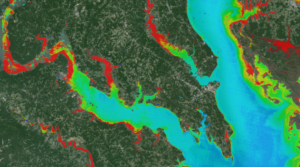
No, this isn’t the Northern Lights. This is a phytoplankton bloom in Lake Erie, captured by Landsat 8 in September 2017. This massive concentration of microscopic aquatic plants is a regular occurrence in bodies of water worldwide and can present serious harm to humans and wildlife.
Though water is notoriously difficult to study from space, engineering improvements to the sensitivity of OLI allowed Landsat 8 to identify these blooms in greater detail and help water managers inform the public.
Lake Erie is no stranger to these types of blooms, particularly during the summer, when warm temperatures and agricultural runoff frequently cause phytoplankton blooms that can last months at a time. This particular bloom lasted from July to September.
From the Great Lakes, we traveled to Utah’s Great Salt Lake, the largest saline lake in the country and the eighth largest in the world.
This image, captured in June 1985 by Landsat 5, shows the lake at its highest level.
Following a string of years of record rainfall and snowmelt runoff.
Flash forward 27 years later to this image captured in July 2022 by Landsat 8 showing the lake at its lowest water level elevation on record.
So, what happened to all the water?
The answer? A decades-long megadrought and, at least in part, us.
The diverting of water for housing and agriculture in the surrounding area has been standard practice for almost a century. But the increase in population around Salt Lake City caused these diversions to intensify in recent decades.
The Great Salt Lake’s shrinking shoreline is a great example of just how critical the effective management of our planet’s water resources will be in the coming decades.
After precipitation, the second largest component of the water
cycle is evapotranspiration.
The process through which water leaves plants, soils, and other surfaces
and returns to the atmosphere for the agricultural industry.
Knowing evapotranspiration rates helps them to use water more efficiently and yes, combining OLI and TIRS data from Landsat 8 can help with that.
Enter OpenET, a web-based platform developed with NASA’s support, which uses data from satellites like Landsat 8 to provide information on water
consumption and crop water requirements in areas as small as a quarter of an acre at daily, monthly, and yearly intervals.
This helps farmers make data-driven decisions on how to manage their increasingly scarce water resources. And just as Landsat 8 data are used
to help manage water resources, it’s also used to track the growth
of the crops that use those resources.
Tracking and estimating of crop types and yields are tall tasks for agencies such as the USDA’s Cropland Data Layer program. To meet the challenge, they looked skyward. Employing the services of satellites including Landsat 8 to help monitor dozens of crops across the lower 48 states.
The detail offered by Landsat 8 helps the USDA track crops in real time,
allowing farmers and traders to estimate crop yields, set prices, and even highlight shifting trends in crop selection.
And when disaster hits, such as in 2019, when heavy spring rains flooded millions of acres of farmland across the country, the USDA can turn to data from satellites like Landsat 8 to highlight the areas most affected and provide accurate yield estimates
From the rural corn and wheat fields of America’s heartland. We turn our eyes towards the city. Lacking in sufficient tree cover, our cities can be prone to suffering from the heat island effect as an excess of impervious surfaces
absorb and remit the sun’s heat.
Trees have plenty to offer in the way of environmental benefits, capturing carbon dioxide and reducing stormwater runoff.
Research also shows that a lack of trees could not only affect the temperature, but our overall health and well-being.
Using data from Landsat 8, researchers studied vegetation coverage in urban areas around the U.S., which revealed that a significant disparity in tree cover across urban neighborhoods leads to differences in temperatures and health outcomes.
Landsat 8 has proven again and again that in times of crisis, it can be relied on to provide emergency responders with critical data before, during and after disaster strikes.
As climate change continues to evolve, North America’s fire season has increased both in frequency and intensity.
The 2018 Camp Fire captured by Landsat 8’s OLI instrument, was the deadliest and most destructive wildfire in California’s history. Raging for 18 days before finally being contained by firefighters.
Using thermal data from Landsat 8’s TIRS instrument, we can even delve
beneath the smoke to witness the blistering temperatures of the fires below.
Landsat data such as this can be used by fire management programs to document severity and regrowth of burned areas, providing crucial information for better management of forests and natural resources.
Fires aren’t the only natural disasters North America contends with each summer-Hurricane season kicks off every year on June 1st, and as ocean temperatures trend upward due to climate change, so have hurricanes’ ability to lay waste to island and coastal communities.
On September 20th, 2017, Hurricane Maria slammed into Puerto Rico with ferocious winds that stripped a third of its forests bare.
A year later, data captured by Landsat 8’s OLI instrument over Puerto Rico’s El Yunque National Park, an area particularly devastated by Maria’s high winds, clearly demonstrates nature’s innate ability to heal itself as Puerto Rico’s forests bounce back from disaster.
Some of the world’s other natural features have not been so resilient.
Landsat’s ability to track changes to the Earth’s surface over time has proven a useful tool for observing climate change’s effects on the planet, especially in Alaska’s Glacier Bay National Park, whose famous inhabitants
have fallen victim to glacial retreating.
The park’s Grand Plateau Glacier once reached almost all the way to the ocean. But this image, captured 35 years later
by Landsat eight, reveals the true magnitude of the retreat
affecting the glacier.
Evidence suggests that the loss of ice from ice sheets and glaciers has been the largest contributor to sea level rise over the past three decades.
Landsat 8’s technological advances have enabled tools such as the NASA-funded Global Land Ice Velocity Extraction (GoLIVE) project to map the pace at which glaciers move and helping researchers study what causes ice masses to change
and how much ice will flow into the ocean.
Thanks to the nature of its polar orbit and thermal data, Landsat 8 is always on hand to capture extraordinary events, especially during polar winters, when there’s no visible light to see what’s happening. But thermal data from Landsat’s TIRS instrument observed the difference in surface temperature between Antarctica’s Larsen C Ice Shelf and the surrounding water in July 2017, revealing the moment this trillion-ton slab of ice the size of Delaware broke away, forming iceberg A68.
Ten years in, it’s abundantly clear that Landsat 8 has made profound contributions to not just the scientific community but the world at large.
And, with its original design life of five years firmly in its rearview mirror, Landsat 8 is still going strong, and operating in tandem with
its younger sibling, Landsat 9, which joined it in orbit in 2021 to
provide an 8-day revisit time.
And the next phase of the Landsat mission, aptly named Landsat Next, is already on the horizon, with plans to launch a trio of smaller satellites offering enhanced spectral coverage, finer spatial resolution, and a shortened revisit time.
So, hats off to you Landsat 8 and best of luck on your journey, extending a legacy of 50 years of continuous land observation.


