
Then, when Landsat 8 collected data as it under flew its predecessor, Landsat 7, en route to its home orbit, thermal measurements of the same region of Earth taken at the same time by the two satellites—which should have been the same—showed several degrees of error.
Something was definitely wrong.
To solve this mystery, the Landsat calibration scientists, or cal team, had to look for clues.
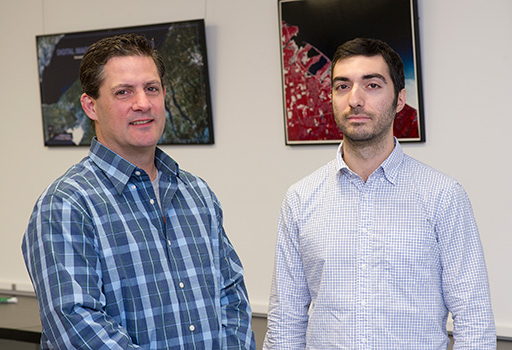
Matthew Montanaro and Aaron Gerace, two thermal imaging experts from Rochester Institute of Technology’s Center for Imaging Science and members of the cal team, were on the job.
Clue #1—Near & Far
As part of the standard post-launch commissioning, radiance measurements made by the TIRS instrument were compared to ground-based measurements made from lake-based buoys. This process of comparing satellite measurements to “ground truth” is called absolute calibration.
The absolute calibration verified that there were significant errors for certain scenes that were severe enough to violate Landsat’s rigorous quality requirements.
Oddly, while errors were detected in TIRS’ thermal measurements of the ground, internal calibration measurements (measurements of an onboard light source called a “blackbody”) were good.
In fact, looking at just the onboard calibration, TIRS was exceeding its performance requirements for both noise and stability.
“The calibration results from the onboard blackbody indicate that the instrument is extremely stable. The absolute calibration data was giving us comparatively huge errors; that doesn’t square with an instrument that looks to be rock solid,” calibration scientist and cal team member Julia Barsi explains.
This discrepancy told the cal team that when the telescope was looking at a uniform source of energy that filled the telescope’s field-of-view, the problem disappeared.
Clue #2—Overlap

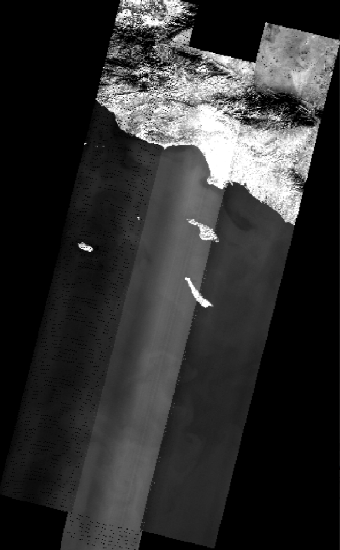
The center SCA overlaps with portions of the right and left SCAs. In the places of overlap, coincident measurements of the same ground location are made—and should measure the same radiance. But in some cases their measurements drift apart causing that “banding” that first alerted the cal team to a problem.
The cal team ran tests to make sure the environmental conditions aboard the satellite were stable and that varying temperatures on the focal plane were not causing the problem. The focal plane needs to be uniformly cooled to less than 40 K (-388º F), while the telescope optics need to operate at 186 K (-125º F).
Conditions proved stable indicating that the instrument’s operating environment was not the problem and that the errors were not being caused by any internal instability.
Clue #3—Hot & Cold, Time & Place
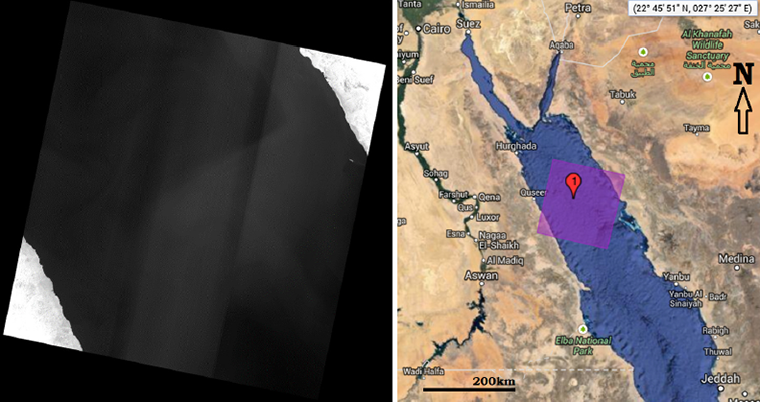
In scenes that showed both desert and sea, it was noticed that the SCA overlap differences seemed to loosely correlate with the transition from hot land to cool sea, and these differences appeared to vary with season—they were worse in the summer. Also, the TIRS image radiance was always higher than “ground truth” measurements.
Given all of these clues, the instrument team started to suspect that radiance from outside of the scene might be scattering into the telescope’s field-of-view, making some radiance measurements higher than they should be. This would also explain why the errors were varying—energy from varying places was hitting the detectors as the satellite collected data along its path. And it would explain why the errors were worse in the summer, when the surrounding land and water were warmer.
Looking to the Moon for Answers
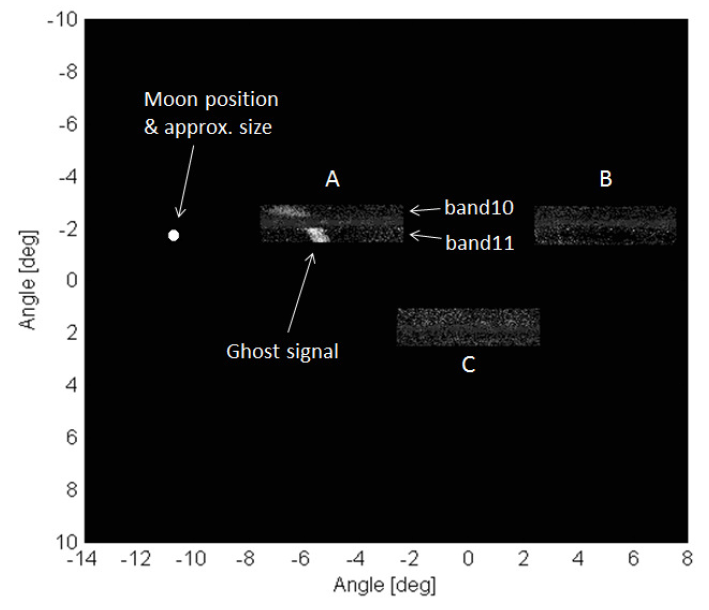
To test this stray light theory,a bright, concentrated light target was needed, one surrounded by darkness that could be imaged to see if any energy from outside the telescope’s field-of-view showed up in the data before the telescope set its sights on the target.
A signal from an out-of-field source, or a “ghost signal,” could be found this way.
The moon held the answer.
The moon, a bright object surrounded by darkness, was the perfect target. Landsat 8 looks to the moon each month as part of its calibration process.
Lunar scan data confirmed that light from the moon was showing up in the data before the moon was in the telescope’s field-of-view.
The cal team had found a ghost.
Putting it Together
The lunar scans had confirmed that stray light (i.e., the “ghost signal”) was causing the errors they were seeing.
“The error in bias was a direct result of the stray light, since more radiance was getting to the focal plane than should be.” Barsi explains.
The ghost signal has added as much as 8 K to data readings for the second TIRS thermal band, or band 11. Band 11 errors are typically double those of TIRS’ first thermal band, band 10.

Finding the Ghost-maker

The Landsat 8 flight operations team performed a series of special lunar scans that mapped out the position of the moon throughout the out-of-field area of TIRS. The TIRS optics team (the team that built the instrument) then used these lunar scan data to produce reverse ray traces to find the surface within the TIRS instrument that was causing the out-of-field reflections as well as the source regions “on the ground” that the errant surface was reflecting.
A retaining ring for the third TIRS lens was found to be the errant reflective surface in the instrument. This piece of hardware that keeps the third TIRS lens in place was also reflecting unwanted energy onto the focal plane.
The ghost-maker had been found.
Ghostbusting
After the discovery of where on the ground the extra signal is coming from, Gerace and Montanaro set out to develop a way to calculate what the contribution of that extra signal is, and then subtract that from the TIRS measurements to get the accurate answer.
Since the place on the ground where the extra signal is coming from is outside of the Landsat scene, an estimate of that out of scene signal was needed. Initially, Gerace and Montanaro utilized wide-field-of-view data from the Geostationary Operational Environmental Satellites (GOES) to figure out the radiance measurements coming from out-of-field and fed that into their calculations. This involves accounting for the different orbits, view geometry, and sampling of the wide field-of-view satellite and Landsat
And these calculations need to be made for each TIRS detector—all 2000 of them for all 700+ scenes per day.
It’s good to have a crack cal team.
The cal team is now working on will be tested this winter and spring. Once the team is satisfied with their results, the methodology will be implemented by USGS into their Landsat 8 ground processing system. Once the cal team delivers the solution, the implementation process will take about a year to implement. For now, USGS advises to only use TIRS band 10 for thermal measurements.
2017 Update: The stray light correction developed by Montanaro and Gerace has been operationally implemented into the USGS Landsat data processing system as of March 2017, for details see USGS webpage about the Landsat Collection 1 Data Set.
References:
Montanaro, M., Levy, R., & Markham, B. (2014). On-orbit radiometric performance of the Landsat 8 Thermal Infrared Sensor. Remote Sensing, 6(12), 11753-11769. doi: 10.3390/rs61211753
Additional References (Added Oct. 2017):
Montanaro, M., Gerace, A., & Rohrbach, S. (2015). Toward an operational stray light correction for the Landsat 8 Thermal Infrared Sensor. Applied Optics, 54(13), 3963-3978. doi: 10.1364/AO.54.003963 (https://www.osapublishing.org/ao/abstract.cfm?uri=ao-54-13-3963)
Gerace, A., & Montanaro, M. (2017). Derivation and validation of the stray light correction algorithm for the Thermal Infrared Sensor onboard Landsat 8. Remote Sensing of Environment, 191, 246-257. doi: 10.1016/j.rse.2017.01.029
Gerace, A. D., Montanaro, M., Connal, R. (2017). Leveraging intercalibration techniques to support stray-light removal from Landsat 8 Thermal Infrared Sensor data. Journal of Applied Remote Sensing, Accepted for Publication.
{Note: a number of corrections were made to this article in 2017 to clarify technical items and give correct credit to appropriate teams.}


