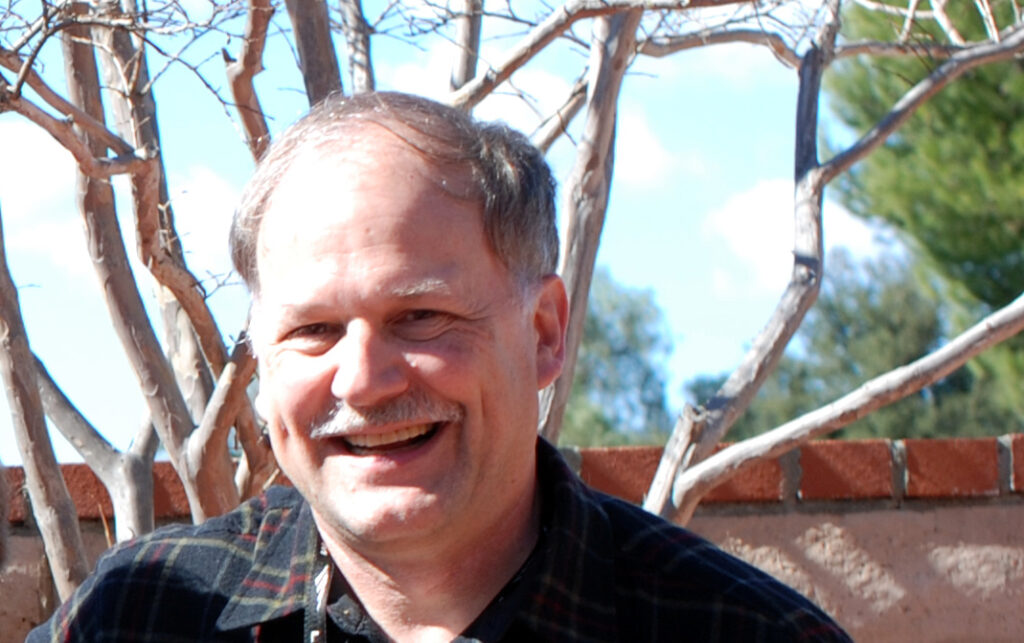
Alison Thieme is a remote sensing scientist and ecologist who is working on her doctorate in Geographical Sciences at the University of Maryland. Here is what Allison shared with us about the work she is presenting today at #AGU19:
Mapping Winter Cover Crop Performance in Maryland
Why does the Maryland Department of Agriculture incentivize farmers to grow cover crops such as rye, wheat, and barley in the fall and winter?
Maryland farmers are incentivized to grow winter cover crops (such as barley, rye, and wheat) by the Maryland Department of Agriculture because the crops serve “to recycle unused plant nutrients remaining in the soil, protect fields against wind and water erosion, and improve the soil for next year’s crop.”
By keeping the nutrients in the soil and reducing erosion, this reduces runoff and improves the overall health of the Chesapeake Bay.
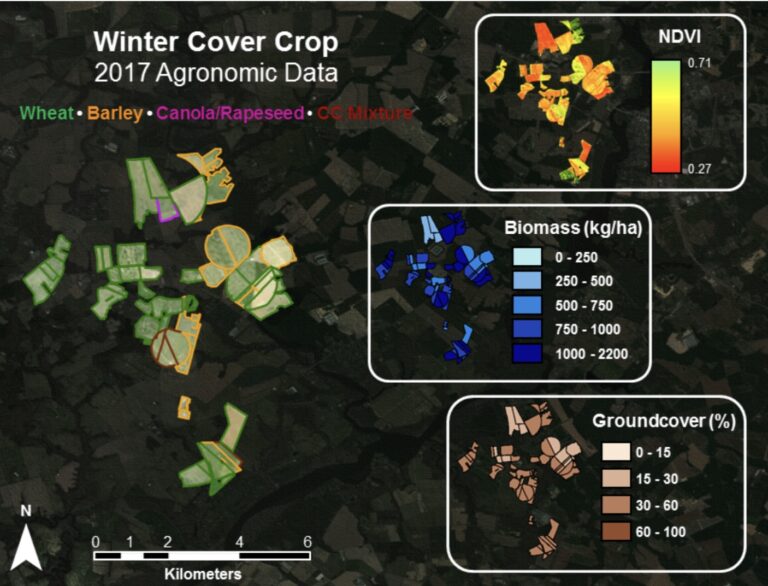
You found that for winter 2017-2018 rye and barley cover crops outperformed wheat fields in Maryland. How so?
Rye and barley tend to be more cold tolerant than wheat, and so grow better under fall and early winter conditions. Also, wheat tends to have later planting dates, resulting in less available warm weather for growth.
So, barley and rye showed higher average biomass and percent ground cover. These metrics are directly related to nitrogen uptake of the plants and plant size, so barley and rye are doing more in terms of keeping nutrients in the fields and preventing erosion.
What are the implications of your findings?
The tools we’ve developed can help the Maryland Department of Agriculture better understand winter cover crop performance and even identify areas that are underperforming in the current season.
Why did you choose to work with NASA/USGS Landsat and Harmonized Landsat Sentinel-2 data for this research?
Our study continues into current seasons, so we need modern Landsat 8 and Hamonized Landsat Sentinel-2 (HLS) data. However, our field calibration data was collected before the Landsat 8 and Sentinel-2 satellites were collecting data, so we needed to rely on the historic Landsat archive to develop a model (based on our 2006–2013 field calibration data and Landsat 5 and 7 data collected at the same time) that could also be used with the modern and more frequent Landsat 8 + HLS data.
The Landsat 8 and HLS spatial resolution enabled us to scale the analysis to the entire state while and the frequency gives us multiple images in each short season. While higher spatial resolution imagery can also be used for this type of analysis, it is cost prohibitive particularly at this scale.
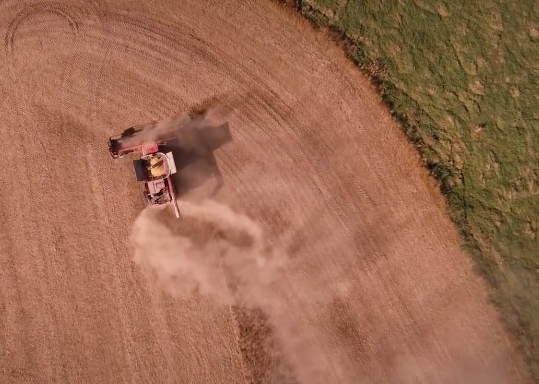
Project video:
Co-authors:
Sunita Yadav
USDA Forest Service
Perry Oddo
NASA Goddard Space Flight Center
John Fitz
NASA
Sean McCartney
NASA Goddard Space Flight Center
LeeAnn King
University of Maryland College Park
Jason Keppler
Maryland Department of Agriculture
Greg McCarty
USDA-ARS
W. D. Hively
USGS
Any opinions, findings, and conclusions or recommendations expressed in this material are those of the authors and do not necessarily reflect the views of the National Aeronautics and Space Administration (NASA). Any mention of a commercial product, service, or activity in this material does not constitute NASA endorsement.
This material is based upon work supported by NASA through contract NNL16AA05C and cooperative agreement NNX14AB60A.
Anyone can freely download Landsat data from the USGS EarthExplorer or the LandsatLook Viewer.
Further Reading:
+ Landsat at the 2019 AGU Fall Meeting