
[Source: Scott Phillips, Peter Claggett, and Heather Dewar, USGS]
“We found in divers places fish lying so thicke with their heads above the water, as for want of nets … we attempted to catch them with a frying pan,” wrote the English explorer Capt. John Smith after his 1608 voyage up the Chesapeake. “Neither better fish, more plenty, nor more variety had any of us ever seen in any place.”
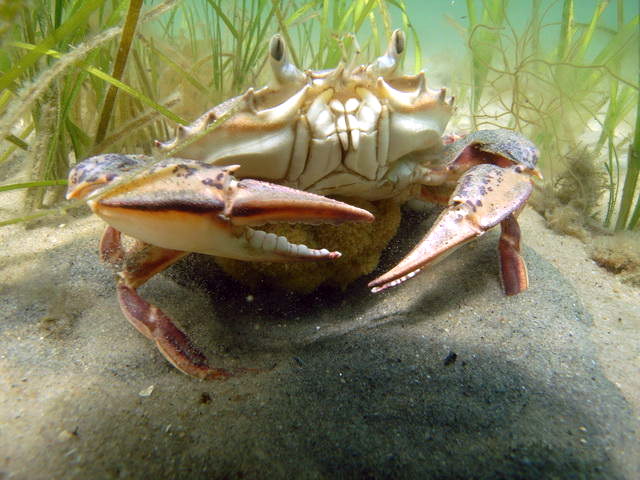
More than 400 years later, the bay is still one of the world’s most productive water bodies, supporting 3,600 different species of fish, wildlife and plants. Fishing, boating, and visits to tourist sites that celebrate the Chesapeake’s traditional way of life bring in more than $20 billion per year. Chesapeake watermen still harvest the bay’s famous blue crabs, striped bass, oysters and other seafood. But these harvests are nowhere near as abundant as in John Smith’s time. And the rivers and streams he explored now flow through natural landscapes interlaced with factories, high rises, city streets, suburban lawns and farm fields. Sewage and stormwater outfalls, runoff from animal manure and fertilizers, and factory wastes have added an overdose of nutrients and contaminants to the estuary. Long-standing water quality troubles threaten commercial and recreational fishing, tourism, and the region’s identity.
In the 1980s political leaders of the six bay states and the District of Columbia created the Chesapeake Bay Program, a voluntary partnership of states and federal agencies committed to using the best available science to guide policies that will restore and sustain a healthy Chesapeake Bay. The U.S. Geological Survey provides much of the science the Bay Program uses to track its progress and inform bay restoration decisions.
Bay Scientists See Signs of Resilience
Today there is evidence that the bay is more resilient than it has been in a generation. A February 2017 Chesapeake Bay Program report found 37 percent of the tidal Chesapeake met water quality standards in 2015, which is far short of the 100 percent goal, but represents a 10 percent improvement over the prior period. Bay grasses, which shelter and feed fish, shellfish and waterfowl, are expanding. Black duck populations are increasing.
About a dozen key indicators are positive, said Scott Phillips, the USGS’ Chesapeake Bay coordinator.
“Picture a team of doctors treating a patient with many ailments,” said Phillips. “We’re making progress on some ailments, but others may take much longer to resolve, and there are complications.”
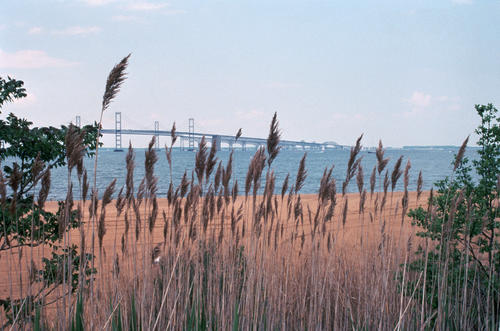
Population growth is one of those potential complications, says USGS geographer Peter Claggett. In the mid-20th century 8 million people lived in the Chesapeake Bay watershed. Today, there are 18 million residents, half of them living within 10 miles of the Bay or one of its tidal tributaries.
“By 2025 the population of the Chesapeake Bay watershed will grow by about 1 million people,” said Claggett, an expert on land use change. “We know this because it’s happened every decade for the past 60 years.”
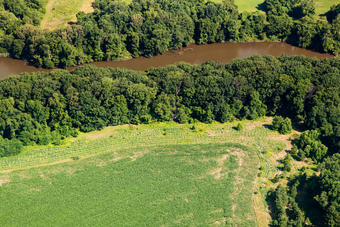
As more people settle in the region, farm fields and forests become subdivisions and stores. And each of these land uses yields a different amount of nitrogen and phosphorus per acre running off into the bay. Claggett heads a team of USGS scientists who have painstakingly developed new tools to accurately characterize the landscape, document how it has changed, and predict how land use changes will play out in the future.
Converting “Eye in the Sky” Images to Sidewalk-Scale Views
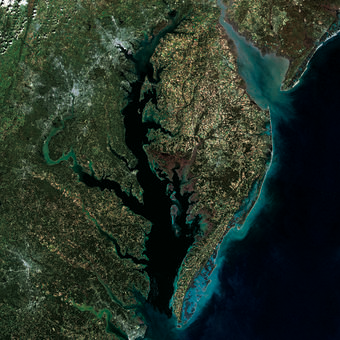
Claggett and his colleagues worked with existing maps, based on aerial photographs, that categorize the region’s land cover into broad categories, but don’t distinguish between a roof, a parking lot and a road. The team also uses annual information produced by USGS’ Land Change Monitoring, Assessment and Projection initiative, based on imagery from the Landsat Program.
“Every pixel in a Landsat image is 30 meters by 30 meters, and parts of the image are often obscured by clouds,” Claggett explained. USGS scientists have analyzed all of the Landsat images collected since the mid-1980s to find every cloud-free instance of each individual pixel. Then they compare the properties of these pixels through time, to see whether and how they have changed.
The team combines all these data and uses them to develop specific information about how the land is actually being used, at the scale of 1 meter by 1 meter. This is one of the most detailed records of land use changes anywhere in the U.S., Claggett said.
“We’re seeing things that haven’t been seen before,” Claggett said. “Now, for the first time we have a full accounting of all development. We know where and when changes have happened.”
While lower resolution imagery showed about two percent of the 40.1 million acres of land in the bay watershed is paved or roofed, the higher resolution version, when it is finalized, will provide a more precise picture. The details matter, since runoff from these impervious surfaces can degrade the Bay’s fish and shellfish habitat. The lower-resolution imagery misses outbuildings, sidewalks, narrow roads and other surfaces that do not soak up pollution the way open ground does, but turns it into stormwater runoff instead.
Combining detailed land use information with research showing how much nitrogen and phosphorus flows into the bay from different types of landscapes, the team can calculate how much pollution is flowing into each part of the bay watershed, at local, countywide and statewide scales.
Working with the support of the Chesapeake Bay Program and the USGS Land Change Science Program, Claggett’s team is going further to inform the states as they make plans to curb pollution over the long haul.
Using population and employment projections developed by state agencies and private consultants, the land use model now being finalized projects what types of development are likely to occur in specific areas. To account for potential errors, each model run is repeated 101 times; the results are considered reliable if the same general pattern appears time after time.
Providing the science for permanent “pollution diets”
These research projects, taken together, provide detailed local estimates of the land uses that contribute nitrogen and phosphorus to the Bay, how those pollution loads have changed over time, and how they are likely to change in the future.The information comes at a critical time. In October, state leaders are expected to take an important next step: setting up localized, long term “pollution diets” for the amount of nitrogen, phosphorus and sediments, from all sources combined, that can enter the bay and each of its tidal water bodies.
Imagine if all the inhabitants of a region went on a permanent diet, agreeing to consume no more than a custom-selected number of calories per day, forever. That’s a rough analogy for the upcoming “total maximum daily loads” or TMDLs. Most of the bay’s water bodies receive more pollution now than their TMDLs are expected to allow, so the states will have to implement pollution reduction measures, one waterway at a time.
The states are pledging to achieve those pollution reductions by the year 2025, and maintain them permanently. The idea is that once every stream’s pollution burden falls to or below its set limit and stays there, the result will be a healthier and sustainable Chesapeake Bay.
“TMDLs are forever,” Claggett said. “They are a commitment to reduce pollution to a certain level by a certain date, and never increase it. The challenge is, if you evaluate how effective your TMDLs will be in 2025 based on the land uses that are in place today, you will be off by one million people. And over time, as the population increases, the margin of error increases.”
A Tool to Make Environmental Restoration Faster, Smarter
Claggett’s group is factoring in population growth as it prepares statewide analyses of projected land use changes for all the bay states – New York, Pennsylvania, Maryland, Delaware, Virginia and West Virginia – and the District of Columbia. To maximize their usefulness, the projections will cover the entirety of each state, including portions that fall outside the Chesapeake Bay watershed.
Finally, the group will use the completed computer model to generate new information to help state and local officials understand their options for managing bay pollutants over the long term. “We’ll change some of the assumptions the model uses to address key questions that state and local governments need to have answered,” Claggett said. “For example, if for every acre we develop, we conserve an acre of forest, to what extent will that help minimize the impact of growth?”
The work by Claggett’s team has the potential to revolutionize environmental restoration not just in the Chesapeake, but in other economically important estuaries across the nation, Phillips said. “The big picture is that with what we’re learning in the Chesapeake Bay, we can help policy makers all over the country achieve their goals, and do it faster and smarter,” he said.
Related Reading:
+ Landsat’s Role in Chesapeake Bay Management
+ Monitoring Changes in the Chesapeake Bay Watershed
+ The Chesapeake Bay in 661 Million Pixels


