
Liheng Zhong, a Senior Delineator with the California Department of Water Resources is working on a way to map rice fields with Landsat to better manage water use. He presented some of this findings at #AGU15, here’s what he shared with us.
Presentation title:
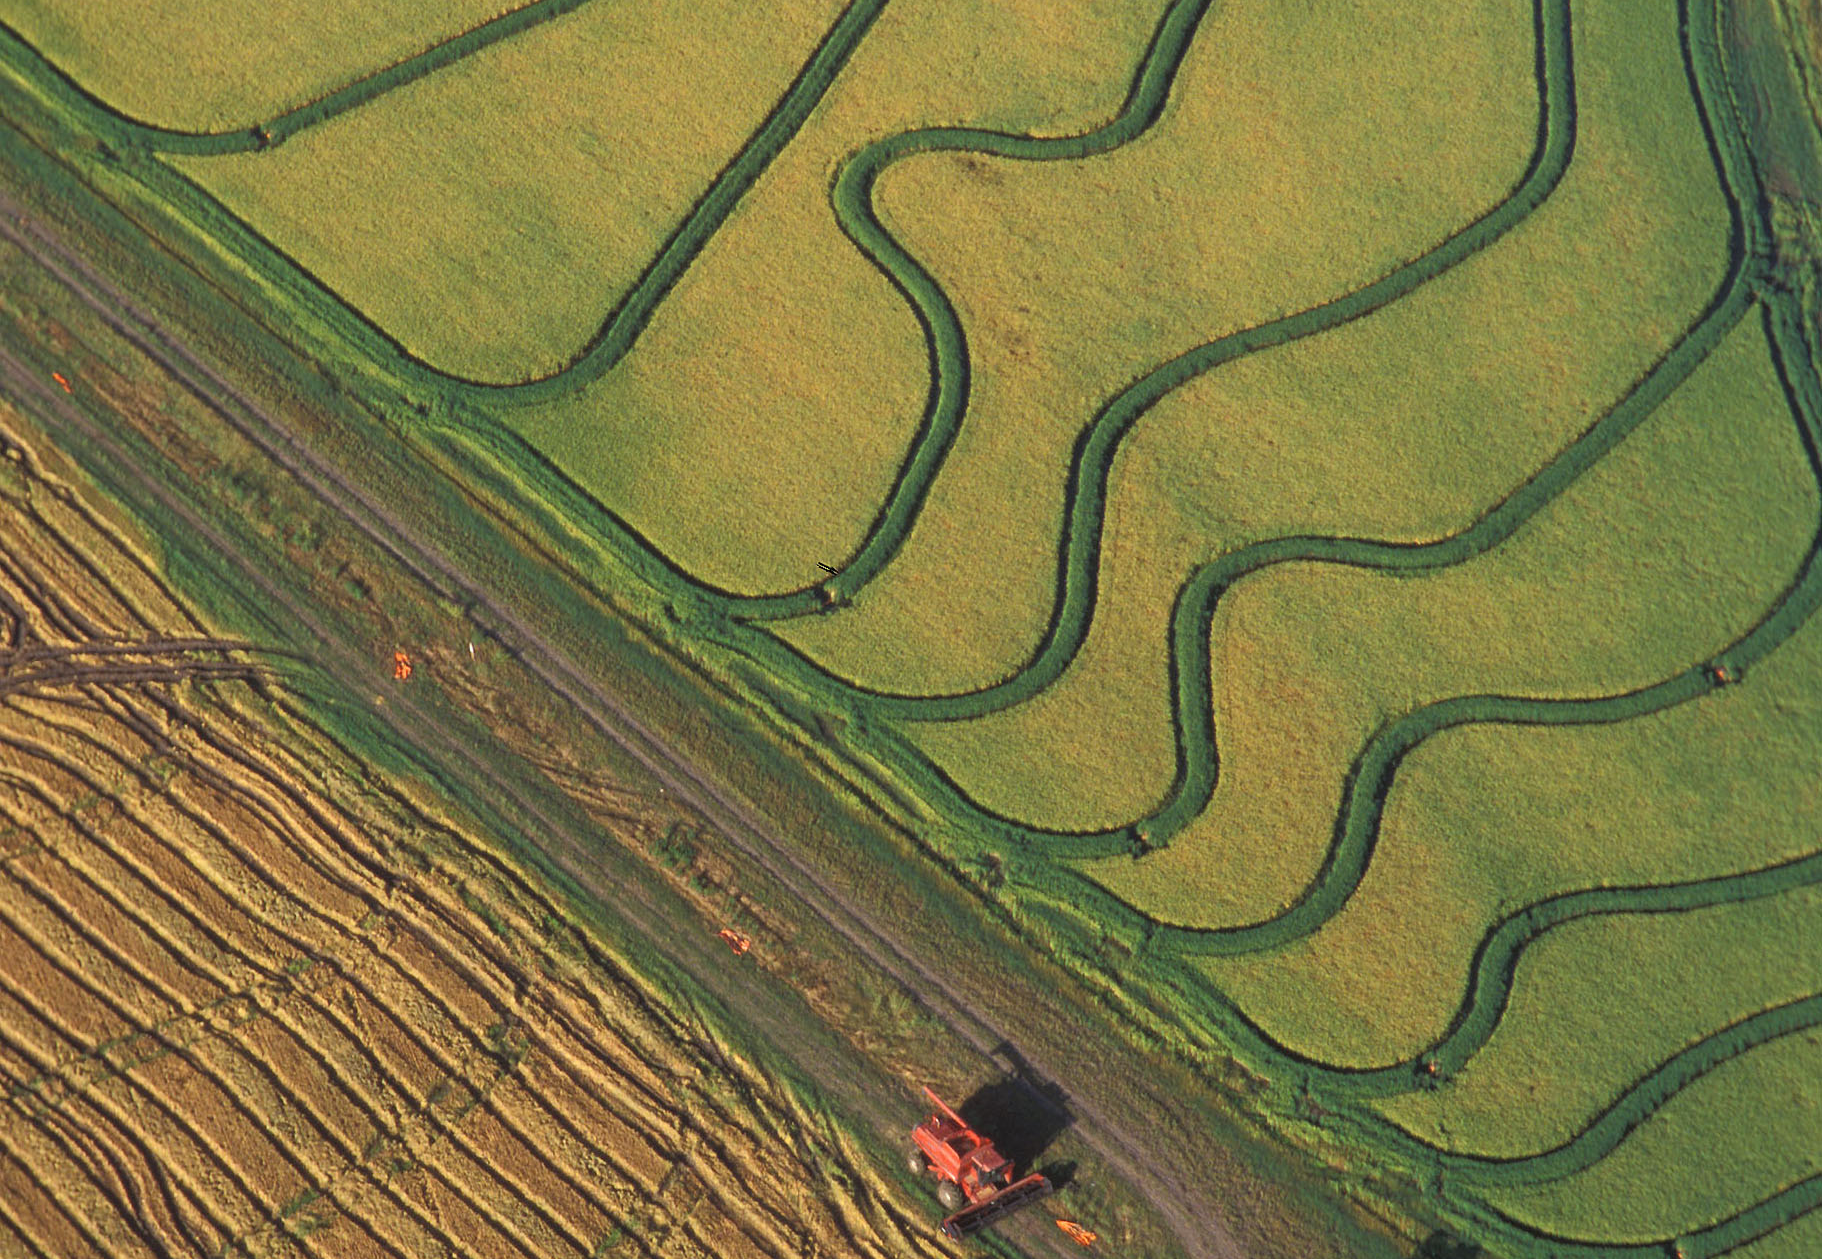
Automatic mapping of rice fields in the Sacramento Valley for water resources management
What are the major findings of your research?
The major findings of my research are that we may be able to map rice fields in June around the early growing season without training data collection to facilitate timely water use estimate and water planning, and we may also use Landsat image series to detect rice phenological stages and discover the change in rice growing season during past decades.
What insight did you gain from Landsat that would have been impossible to glean otherwise?
Landsat satellites offer a long historical record at 30 m resolution since 1980s. In the Sacramento Valley, Landsat might be the only option to study decadal changes of rice fields at a decent resolution.
Is the CA Department of Water Resources using your data? If so, how?
Rice is the largest water user in the Sacramento Valley, and so reasonable estimates of rice extent and its growing season are critical for water management. In our division we are exploring the feasibility of using Landsat-derived products as an independent data source to improve the efficiency of hydrological modeling and enable semi-real-time water use projection.
Co-authors:
Hongbing Yin
California Department of Water Resources
Erik Reyes
California Department of Water Resources
Francis Chung
California Department of Water Resources
More details from Zhong’s AGU Abstract
Water use by rice fields is one of the most important components in hydrologic model simulation of the Sacramento Valley, California. In this study, rice fields were mapped by an automatic approach using Landsat imagery. The automatic approach is advantageous for its capacity of mapping rice fields repeatedly, consistently and timely without the need to collect training data. Seasonal dynamics of Enhanced Vegetation Index (EVI) and Normalized Difference Moisture Index (NDMI) were employed to identify rice based on its phenological characteristics. Classification could be conducted around planting date for early response to cropland use change, or for the full growing season to monitor rice growth. Two studies are illustrated as the applications of this mapping method:
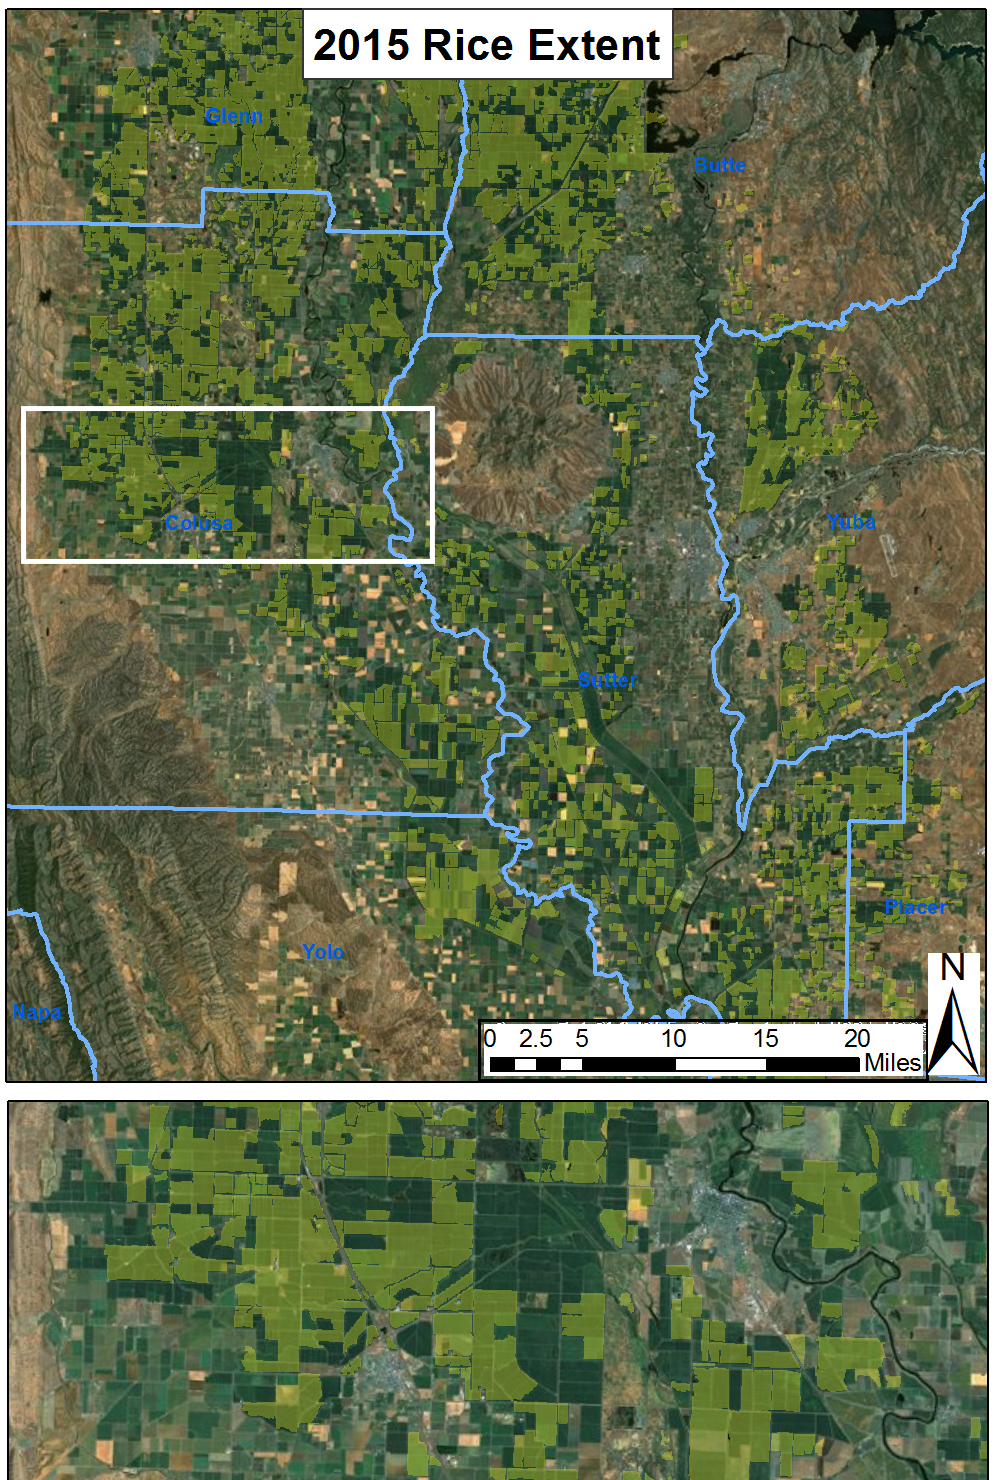
1. A rice map was produced before mid-June to forecast rice acreage and water use in the 2015 drought. Due to continuous drought, rice acreage in the Sacramento Valley reached the historical minimum of the past 20 years in 2014, and further reduction is occurring in 2015. A quantitative measure of rice field extent is needed to forecast rice water use as early as possible. The automatic mapping method utilized the spectral dynamics during initial flooding to identify rice fields. Based on the map product, the forecast of rice water demand was made to facilitate the simulation of current-year hydrologic conditions.
2. Rice field extent has been mapped since 1989 and phenological metrics have been derived to study the change in growing season. The increasing use of short-season rice varieties and special weather condition (like El Nino in 2015) may alter the seasonal pattern of water demand by rice. Rice fields were identified based on the temporal profiles of NDMI and EVI derived from series of segmented images. Validation using field survey data and other land use maps showed a promising accuracy. The start and the end of the growing season and other phenological metrics were extracted from object-level temporal profiles of EVI by a curve-fitting method. The monthly pattern of water demand by rice fields was depicted for each region and each year to improve the calibration of hydrologic simulation models.
Anyone can freely download Landsat data from the USGS EarthExplorer or LandsatLook.
Further Reading:
+ Landsat at #AGU15


