
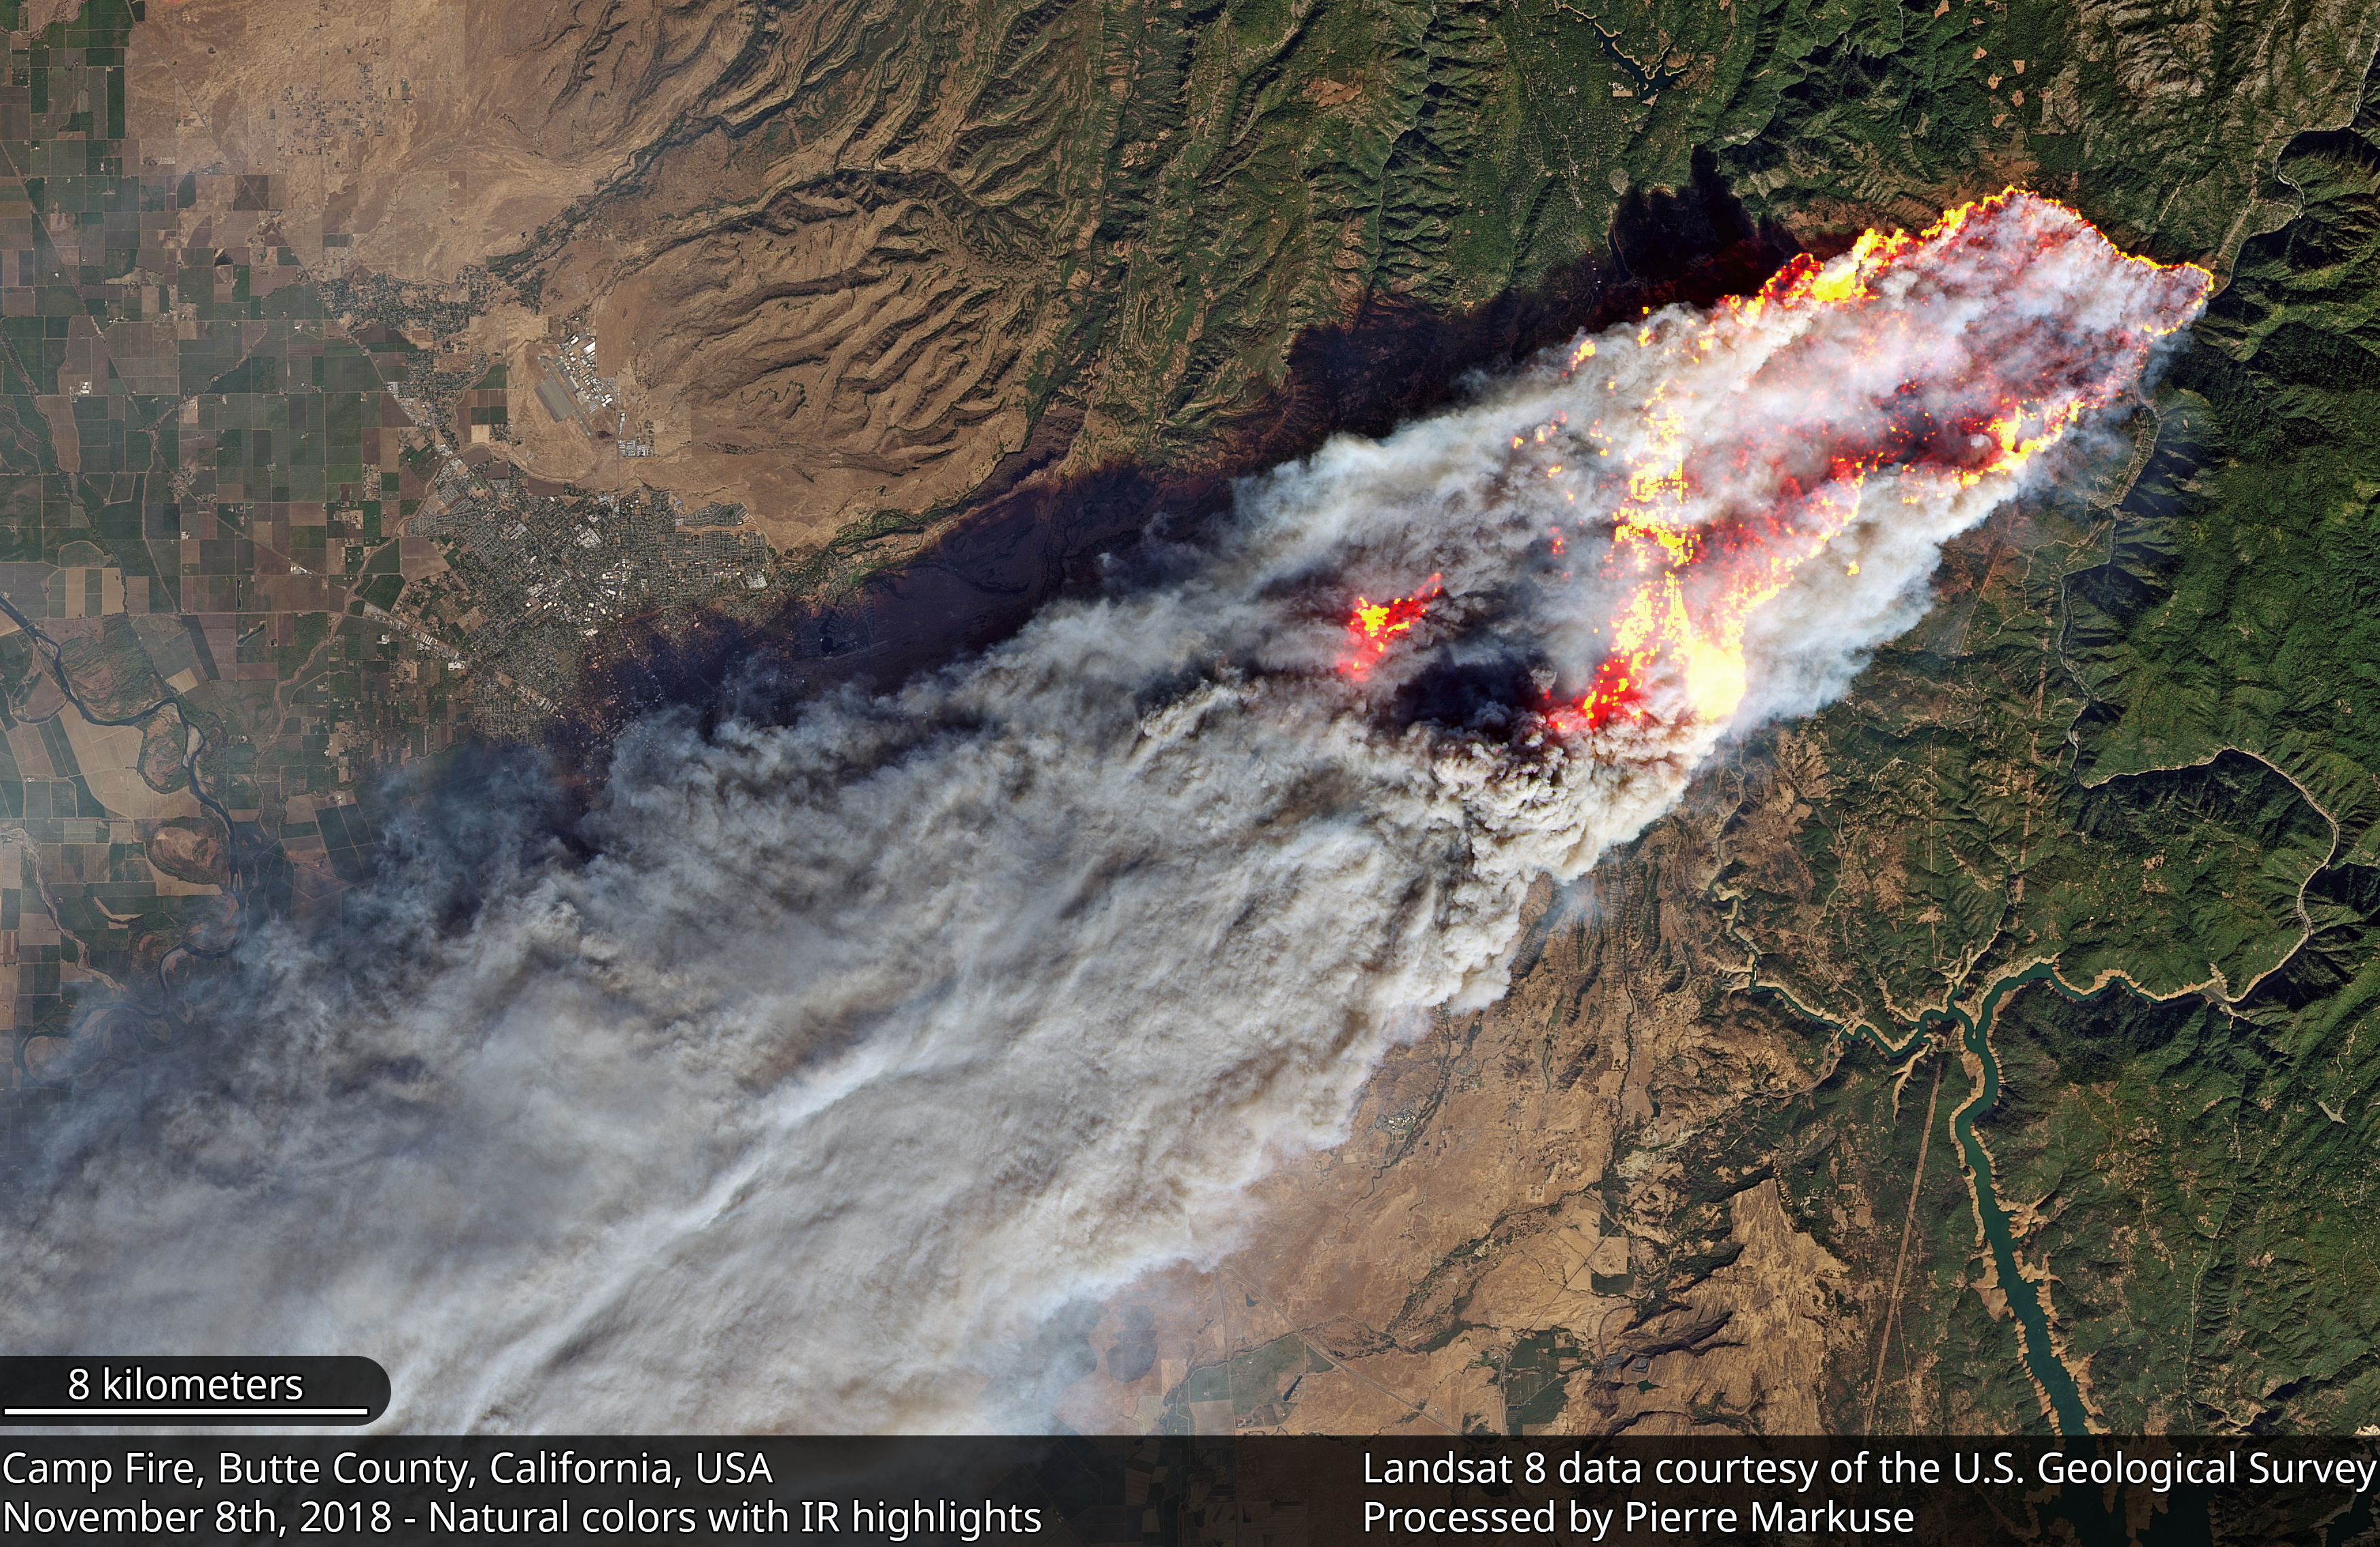
As 2018 closed, Discover Magazine blogger Tom Yulsman posted to his ImaGeo blog about the most gripping image he’d seen during the year. The “particularly compelling” one he chose was a Landsat 8 image of the Camp Fire in northern California.
Inception
The Landsat 8 data behind this image, which made repeated appearances in the media, told a striking story of both the extent and the speed of the blaze.
Landsat 8 acquired the image on Thursday, November 8 at 10:45 a.m. local time, a mere four hours after a small fire off Camp Creek Road had started the conflagration. It would become California’s deadliest fire, killing 86 people and burning more than 14,500 homes and businesses in the foothill town of Paradise.
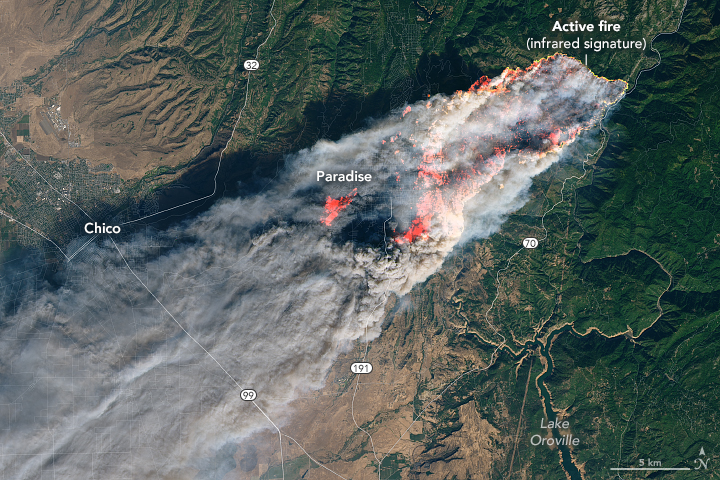
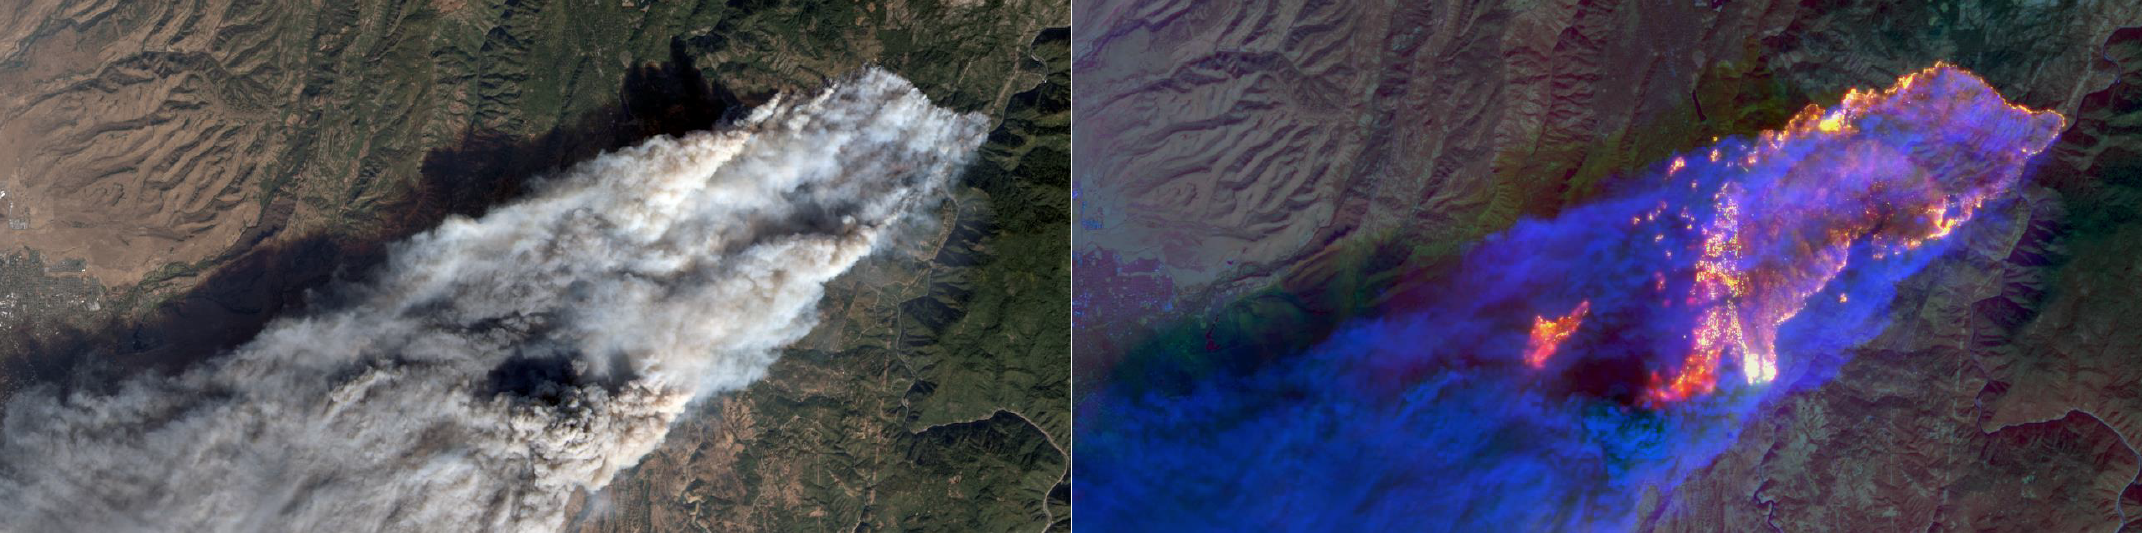
The Landsat image revealed that half of Paradise was already burning that morning. The fire’s extent was visible through the smoke because of data the satellite collects from wavelengths beyond human range of sight (namely the shortwave infrared (SWIR) and Thermal Infrared (TIR) regions).
The Camp Fire burned more structures than any before in California’s history (18,804 in total when including support structures like sheds and garages). Flames consumed nine out of every ten homes in Paradise, in what is now recognized as the deadliest fire in America since 1918.
As Yulsman wrote in his initial blog post two days after the fire began:
“In all the many years that I’ve covered wildfire, I don’t believe I’ve encountered anything like what we’ve seen with the Camp Fire blazing in California’s northern Sierra Nevada mountains. What really shocked me was the speed with which this cataclysmic inferno progressed.”
At UC Berkeley, geography professor Jeff Chambers used this Landsat 8 image to calculate the speed of the fire. Given the known start time of 6:30 a.m. and the collect time of the satellite, he calculated that the fire had been traveling 3 mph during those first four hours, stoked by dry easterly winds tearing across California’s Sierra Nevada mountains from the warm deserts of Nevada. Winds speeds that day were 30 mph with gusts up to 50 mph.
Chambers and other fire specialists also used this Landsat data to verify the “leapfrog” behavior of the fire. Embers blown by the dry winds started spot fires along the western front, jumping 2.5 miles ahead of the main fire front. The Landsat image captures the fire behavior behind this devastating disaster.
As Chambers told Berkeley News, “It’s astonishing. You can see the fire burning right through the city.”
In nearby Chico, California, Zeke Lunder, a pyrogeographer and founder of Deer Creek GIS, used the Landsat image together with topographic data and road overlay information to create a number of 3D renderings of the fire.
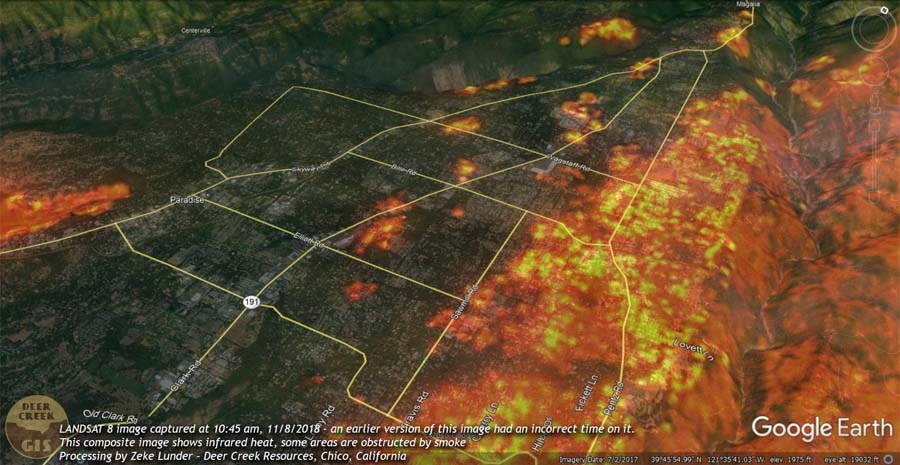
Lunder and his team used the Landsat image to create fire perimeter and progression maps. He used the maps in public meetings to, as he explained, “help people understand how the fire spread in its initial stages.”
Deer Creek GIS often uses Landsat to do regular landscape-scale fire hazard assessments, but the timing of this Landsat 8 image and what it showed was astonishing to even Lunder:
“We rarely are able to find images such as this, which capture the peak burning period of a major fire we are working. The size of the spot fires, distance the spot fires were ahead of the main fire, the hot spots—each a burning home—the width of the flaming front, and the fire’s impingement on all of the major evacuation routes, all tell a crazy story, capturing a remarkably dramatic and traumatic point in time.”
The town of Paradise is nestled into the foothills of the Sierras, situated on a ridge between two canyons. It’s a gorgeous geography, but one with limited escape routes. The Landsat 8 image captured how horrifyingly fast the fire spread, and why there was little or no time for evacuations. The Guardian interviewed 50 Camp Fire survivors from Paradise and their story paints a vivid picture of just how terrifying this fire was to live through.
It took more than 2,000 fire fighting personnel and nearly three weeks to finally quell the flames.
Fueling the Fire
In interview after interview in the days after the fire started, fire researchers commented that the dry conditions accompanying our changing climate have shifted the nature of fires, increasing their ferocity.
Sprawling urban fires that once regularly plagued civilization were thought to be a thing the past—the Camp Fire let us know they are back.
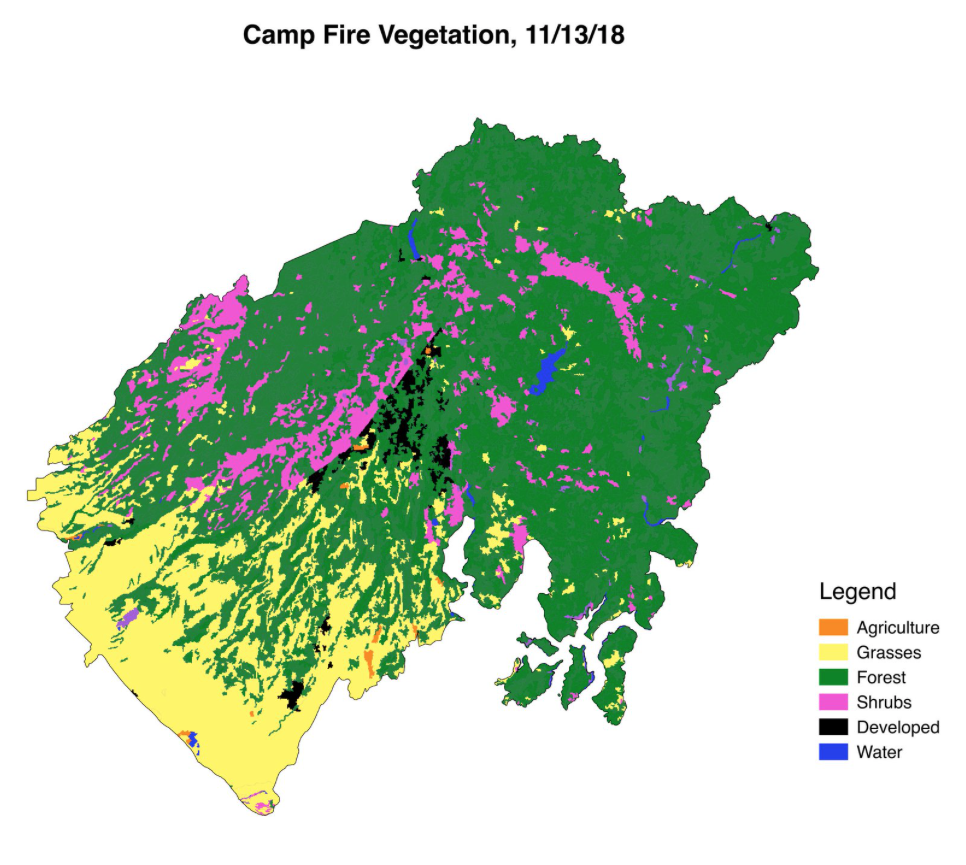
Why was the Camp Fire so fierce, so aggressive? The drought conditions and the strong winds were factors, as was the “fuel,” i.e. what was burning.
After some mischaracterization, the Camp Fire was clarified as a wildland fire—a fire burning a mix of grasses, shrubby vegetation, and forest. It was this patchwork of vegetation that fueled the Camp Fire—a mix of vegetation that, after years of drought conditions, had become a dry fuel load.
As fire ecologist and science writer Allie Weill wrote for KQED Science prior to the Camp Fire, “Fuel Matters” and firefighters must pay close attention to land cover because it effects how a fire behaves.
Weill created a number of land cover maps for her article showing the different types of vegetation, or fuel, that was found where some of California’s worst fires were located. To create the maps she used open CALVEG data along with fire perimeter information from CAL FIRE, the California fire protection entity.
The CALVEG dataset is today derived from a mix of Landsat data, aerial data and field information, but the data set has a long association with Landsat.
Its acronym stands for Classification and Assessment with Landsat of Visible Ecological Groupings. The U.S. Forest Service created the initial dataset using first generation Landsat data in the 1970s.
Prevention and Preparedness in the New Age of Mega-Fires

With a repeat cycle of every sixteen days it is rare for Landsat to image a fire within hours of its onset, as it did for the Camp Fire. But the mission’s long archive and well-calibrated data set makes it essential for fire management in other ways.
In addition to informing land cover data sets such as CALVEG, Landsat is integral to a number of fire management programs including LANDFIRE, an interagency endeavor that provides vegetation fuel data for the entire U.S.; Monitoring Trends in Burn Severity, or MTBS, a program that uses Landsat to map burn severity and fire extent, watching for fire behavior trends, and the Burned Area Emergency Response program, which puts teams on the ground armed with Landsat-based burn severity maps immediately following fires to aid in post-fire remediation efforts.
NASA uses Landsat alongside its other space-based Earth-observing resources to provide data to fire managers before, during, and after a fire as part of its Disasters Program. Landsat also helps inform NASA’s RECOVER program that provides online mapping tools with spatially relevant data that fire managers need.
Meanwhile, the European Space Agency is test-piloting a Fire Detection Service that processes Landsat data in real time, scanning for any fire signatures and alerting responders when a fire is detected.
As the Camp Fire has forced us to recognize, the trend towards bigger and faster wildfires cannot be ignored, especially as cities grow towards wildland areas.
In California, five of the state’s most destructive fires have happened within the last two years, and 15 of the top 20 have occurred since 2000. The cleanup of the Camp Fire is still ongoing in Paradise. As NPR correspondent Kirk Siegler reported, federal disaster officials say the work there is the worst toxic debris removal job the U.S. has faced since 9/11.
Good information about the land cover that gives fuel to fires like the Camp Fire is part of any strategy to limit such staggering wildfire tragedies in the future. As landscapes change along with the climate, Landsat and other satellites are giving fire managers valuable insights that can translate into a better chance to protect people.
As Lunder put it, “Landsat is an invaluable tool for people working in our field of community wildfire safety.”
Related Reading:
+ USGS, EROS Offer Insights to National Fire Strategy Discussion, USGS EROS
References:
+ My pick for the most compelling — and scary — remote sensing image of 2018, Discover Magazine/ImaGeo
+ Stunning satellite images and animations offer a sobering perspective on California’s raging infernos, Discover Magazine/ImaGeo
+ New satellite view of Camp Fire as it burned through Paradise, Berkeley News
+ Experts weigh in on how to prevent another Paradise-like catastrophe, The Daily Democrat
+ Fueling the Fire, Slate
+ Last day in Paradise: the untold story of how a fire swallowed a town, The Guardian
+ NASA Disasters Program: California Wildfires in Fall 2018, NASA
+ NASA Mobilizes to Aid California Fires Response, NASA Jet Propulsion Lab
+ Fuel Matters: Why Wildfire Behavior Depends on What’s Burning, KQED Science
+ California’s Deadliest Fire Is Seen Engulfing Paradise in ‘Astonishing’ Satellite Images, Live Science
+ 2018’s Billion Dollar Disasters in Context, Weather Nation
+ Top 20 Most Destructive California Wildfires, CAL FIRE
+ Camp Fire Incident Update, CAL FIRE
Story by Laura E.P. Rocchio, NASA Landsat Communication and Public Engagement Team


