By Laura E.P. Rocchio
Today at #AGU17, Peder Nelson, a research remote sensing scientist at Oregon State University in Corvallis, Oregon, is giving a talk on the IceTrendr glacier monitoring project.
Here is what he shared with us about this project:
Presentation Title
IceTrendr: a linear time-series approach to monitoring glacier environments using Landsat
How does IceTrendr “tell the story” of glaciers?
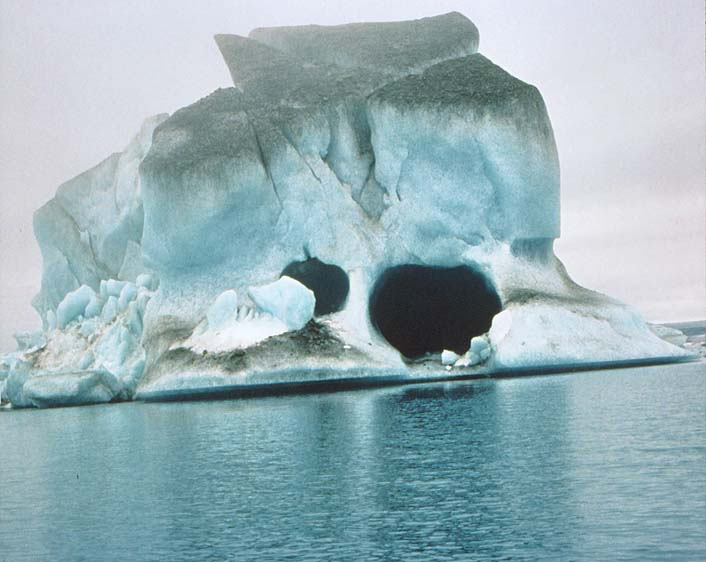
By using all the cloud-free Landsat images, we are able to reveal the dynamic nature of glaciers. In our pilot project, we found the expected glacier areas that are ‘stable’ or have had a transition of glacier ice to rock. However, we also found more complex multi-year changes like ‘transition of glacier ice to debris-covered glacier ice to open water to bare rock to vegetation’.
What is truly innovative is that IceTrendr not only maps the changes but also uses expert knowledge to label the changes and such labels can be applied to other glaciers exhibiting similar temporal signatures.
Do you have plans to make IceTrendr global?
Yes, we are currently testing the temporal segmentation algorithms in Google Earth Engine and NASA Earth Exchange (NEX). The challenge is finding enough on-the-ground data to let us know how our methods work as we move away from these test locations.
What insight did you gain from Landsat that would have been difficult to ascertain otherwise?
The Landsat series of satellite images provides an unprecedented ability to time-travel to back to the 1980’s and then watch not only the glacier change over time but also reveal the patterns and processes that happens when a glacier surges, recedes, or stagnates. One important story, is shrub vegetation starting to grow on top of the glaciers. With the Landsat archive and continued data collection, we are able to identify this change in land cover, rate of vegetation growth, and what it could mean for Earth’s radiation budget.

Co-authors:
Peder Nelson
Oregon State University
Robert E Kennedy
Oregon State University
Anne W. Nolin
Oregon State University
Joseph Michael Hughes
Oregon State University
Justin Braaten
Oregon State University
This research was funded by the National Science Foundation Early-concept Grants for Exploratory Research Program (EAGER) #1449784
Anyone can freely download Landsat data from the USGS EarthExplorer or LandsatLook.
Further Reading:
+ Landsat at #AGU17