Author Henry David Thoreau wrote about wetlands so often he has been called the patron saint of swamps: “I enter a swamp as a sacred place, a sanctum sanctorum . . . I seemed to have reached a new world, so wild a place . . . ” He found wetlands enchanting, relishing every experience from the sights and sounds to the texture of the mud. Even the scent was enticing, which he described as the fragrance of Earth itself.
Since Thoreau’s time, much has changed, and many wetlands are no longer such wild places. Wetlands are often drained for human development, replaced by steel mills, shipping ports, and homes. This encroachment drives away wildlife and contaminates the remaining water. Some of the greatest damage has occurred around the Great Lakes region, home to one of the largest expanses of coastal wetlands in the United States.
Documenting and protecting wetlands has become crucial to the eight states and two Canadian provinces thronging the lakes. While the lakes themselves have been extensively charted, mapping the surrounding wetlands has proven a slippery task.
Laura Bourgeau-Chavez, a researcher at Michigan Tech Research Institute, was familiar with the problem. She said, “In the past, the United States and Canada have had to patch different maps together.” Bourgeau-Chavez uses satellite data to study land cover, and thought she could develop a way to map Great Lakes wetlands. Armed with satellite imagery, hip waders, and a bit of serendipity, she and her team hoped to produce consistent and accurate maps of the entire basin.
Where land meets water
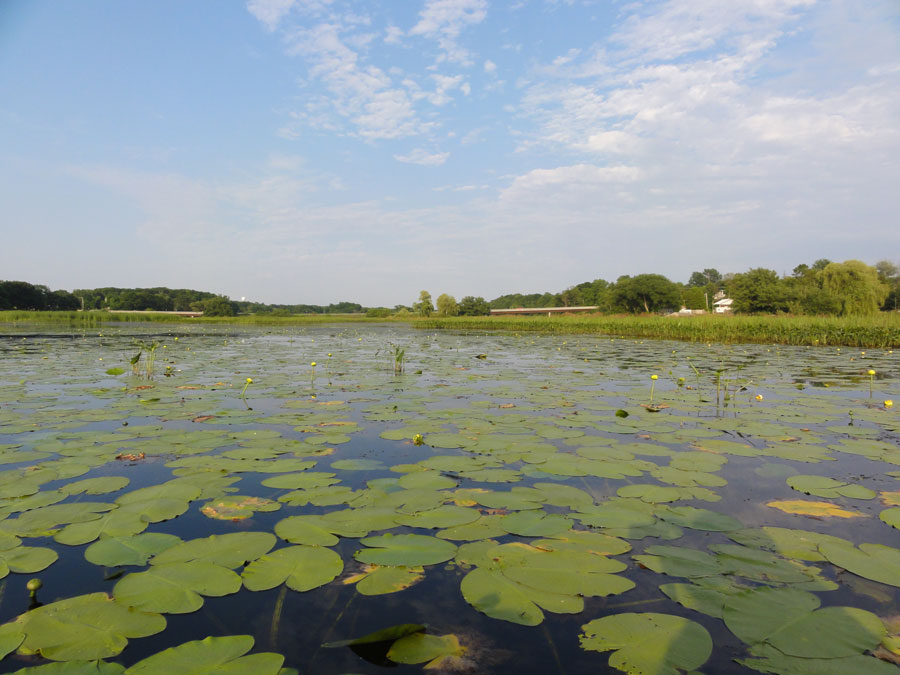
Wetlands are places where land is permanently or seasonally saturated with water, forming a distinct ecosystem that is both aquatic and land-based. Although wetlands may exist wherever water collects, they often border rivers and lakes, creating spongy coastlines astir with fish, birds, and the drone of mosquitoes and dragonflies.
But wetlands are not just scenic retreats. Wetland plants trap sediment, which stabilizes shorelines. They provide a buffer against waves and storm surges. Wetlands also absorb pollutants, preventing toxic elements from flowing downstream or percolating underground. Along parts of Lake Erie, for instance, there are no longer enough wetlands to filter agricultural runoff. Nitrogen and phosphorous now flow into the lake and produce toxic algal blooms that can cover up to 300 square miles.
Across the northern United States, the Great Lakes wetlands cover approximately 35,521 square miles, about the size of Indiana. Yet this is only half their historical area. To protect what remains, the U.S. Environmental Protection Agency funded the Great Lakes Restoration Initiative, which will help clean up toxic areas, control invasive species, and restore habitat. In 2010, the initiative sought something they needed to reach these goals: a map of wetlands across the entire Great Lakes Basin that included both Canadian and U.S. sides.
Although some maps existed, differences in mapping goals and strategies between the two countries and between various interest groups had long prevented efforts to accurately chart wetlands around the entirety of the lakes.
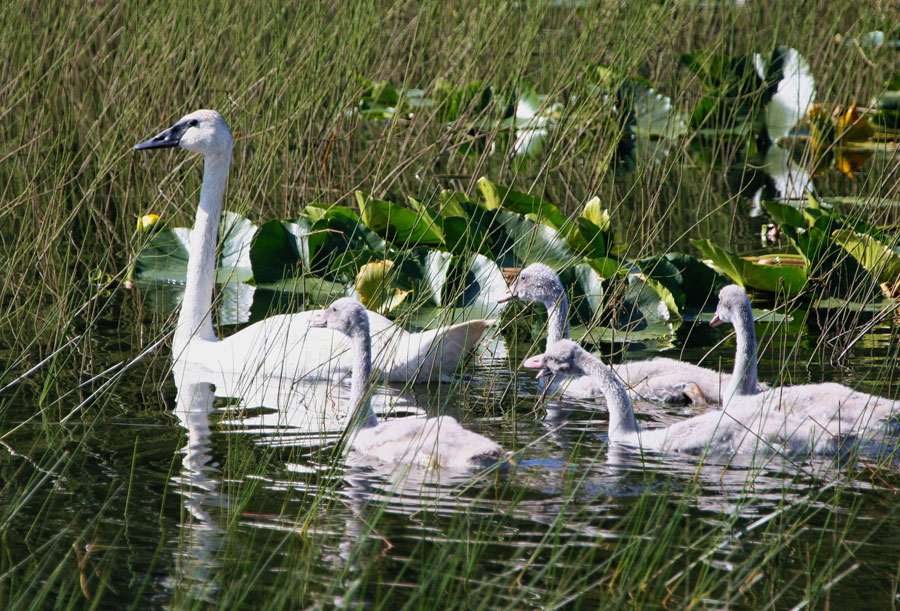

For instance, a biologist may study how migrating geese use wetlands while an urban planner might study whether they can build a new road near that same wetland area. They both collect wetland data, but use different methods, and likely produce results that cannot be easily compared.
Mapping what is wet
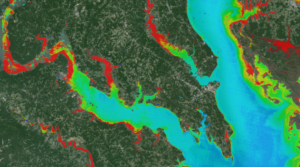
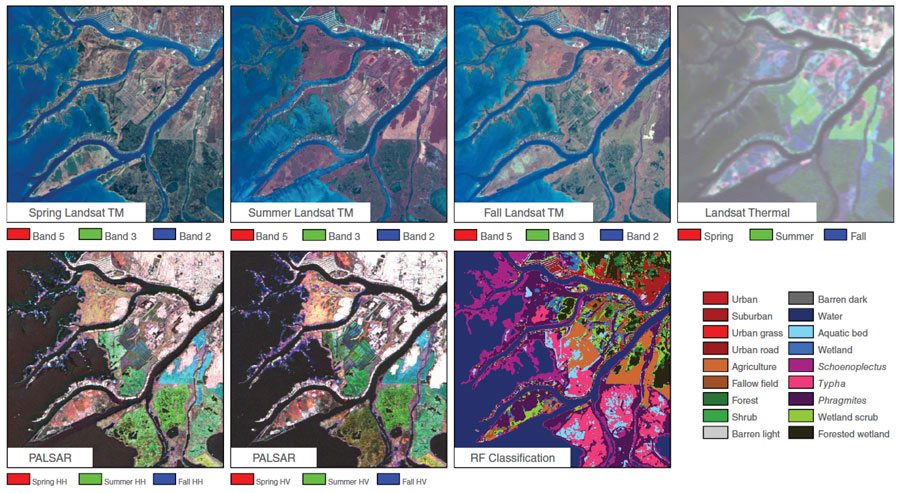
Bourgeau-Chavez and her team set out to collect data in the same ways to measure the same criteria. They relied on imagery from two satellites that could identify differences between land and water, as well as different types of vegetation. Surface temperature data from the Landsat satellite helped them distinguish wetlands from uplands, or higher ground. However, Landsat data cannot accurately see wetlands that exist beneath a canopy of shrubs or forest cover. To penetrate vegetation, the researchers added imagery from the Phased Array type L-Band Synthetic Aperture Radar (PALSAR) instrument on the Japan Aerospace Exploration Agency and Ministry of Economy, Trade and Industry (JAXA/METI) Advanced Land Observing Satellite (ALOS).
Because vegetation can change throughout the growing season, the team collected Landsat and ALOS PALSAR imagery spanning spring, summer, and fall from 2007 through 2011. Images from the two data sets were aligned and mosaicked together to form complete coverage around the lakes. This image fusion allowed the researchers to distinguish wetlands from other types of land cover, and even clarify different types of wetlands, peatlands, and aquatic beds. Distinguishing various wetland types would make the maps more accurate and permit more specific applications, such as identifying aquatic bird habitat or pinpointing invasive plant species.
To verify the satellite images, the researchers conducted fieldwork at 1,191 random sites along the Great Lakes coasts. During the summers of 2010 and 2011, teams donned muck boots and waders before sloshing into the wetlands, carrying precise latitude-longitude locations and laminated aerial photos. Geographer Michael Battaglia helped develop the maps, and conducted fieldwork. “We had to navigate to a predetermined point, and once we got there, we would mark where exactly we were within the aerial photo,” Battaglia said. At each site, the teams noted vegetation types as well as growth stage, height, density, and water levels. When necessary, researchers boarded small boats to reach some of the sites. They also took geolocated photographs for further verification.
A subsequent field campaign from 2012 to 2014 brought the total number of sites to 1,751. That total included visits to the Canadian side of the lakes, part of what made this mapping effort successful. At a conference, Bourgeau-Chavez happened to meet a professor from McMaster University in Ontario who not only offered to share her wetland data, but also had a student who could collect field data using the exact same methods. Bourgeau-Chavez said, “We took the student through all the steps of how to create the maps, and field work, and we sent him off with the algorithm and data sets.”
Finding the flora
Although the teamwork between two countries was crucial, a similarly important factor was the team’s ability to accurately classify various land cover and wetland types. They parsed out twenty-three different types of land cover, including broad classes such as water or forest. The map’s more specific classes, such as shrub peatland and forested wetland, illustrate advantages of the team’s image fusion approach. Previous Great Lakes wetland maps tended to mischaracterize certain types of vegetation, mistaking heavy forest for swamp or wetland. Battaglia said, “You need those different types of data, which allow us to delineate those types of things more clearly than just using air photo interpretation.” The team could also distinguish peatlands, which have been difficult to map. Using aerial photos alone, the texture of a peatland may appear more like the texture of a wetland, but the combination of meticulous fieldwork and satellite imagery clarified the distinction.
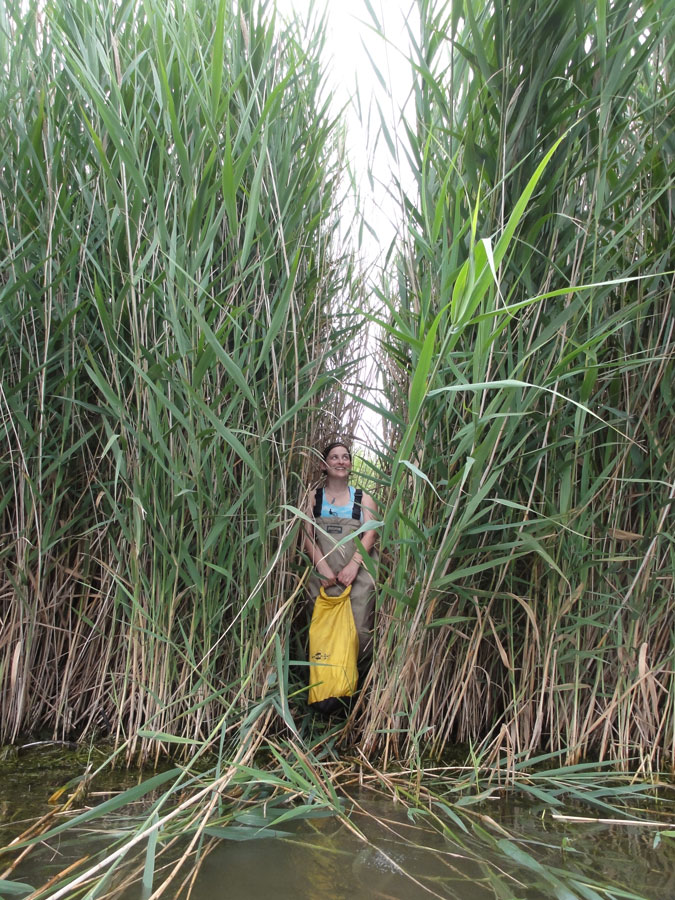
The maps also classified specific invasive species that have infested many of the wetlands. Phragmites, or the common reed, in particular, has been a growing problem along the southern Great Lakes. The thick reeds can grow almost fifteen feet tall. Researcher Sarah Endres often had to bushwhack through stands of Phragmites. “Depending on the site, Phragmites is so dense it’s necessary to break a path just to pass through.” Phragmites blocks sunlight, forces out native plants, and prevents birds from navigating. Extensive Phragmites stands also pose a major problem for people living along the wetlands. Bourgeau-Chavez said, “They’re restricting people’s views of the Great Lakes. Residents can’t get to the water.” Controlling these marauding species is one of the goals of the Great Lakes Restoration Initiative, and with the help of this map, natural resource managers and conservation groups can now locate where invasive species are.
Since the map became available in 2015, conservation agencies and government officials studying the Great Lakes basin have sought it. For instance, the Great Lakes Ecological Forecasting team used the map and field data to create a Phragmites risk assessment across the basin, plus a model to forecast the extent of the species by 2020. And the Michigan Department of Transportation requested the map to see exactly where wetlands existed along the state’s coast, so they could avoid building roads into them, and determine where wetlands might impact existing roads. Whether researchers are looking at invasive species or animal habitat, researchers have a consistent set of map data to rely on. “We’re happy we came up with a nice product for people to use,” Bourgeau-Chavez said. The map goes a long way toward protecting what Thoreau called “the wildest and richest gardens that we have.”
References:
Alaska Satellite Facility DAAC. Developing a Great Lakes coastal-wetlands map using three-season PALSAR & Landsat imagery. ASF News and Notes 11(1), Winter 2016.
Bourgeau-Chavez, L., S. Endres, M. Battaglia, M. E. Miller, E. Banda, Z. Laubach, P. Higman, P. Chow-Fraser, and J. Marcaccio. 2015. Development of a bi-national Great Lakes coastal wetland and land use map using three-season PALSAR and Landsat imagery. Remote Sensing 7: 8,655–8,682. doi:10.3390/rs70708655.
©JAXA/METI ALOS-1 PALSAR L1.0. 2010–2011. Accessed through ASF DAAC, https://www.asf.alaska.edu.
Thoreau, H. D. 1906. The writings of Henry David Thoreau, Journal Volume 4: 1852–1853, ed. B. Torrey. Cambridge: Houghton Mifflin and Company.


