
Presentation Title
Modeling the recovery and degradation of mangroves at the global scale
What are the major findings of this research?
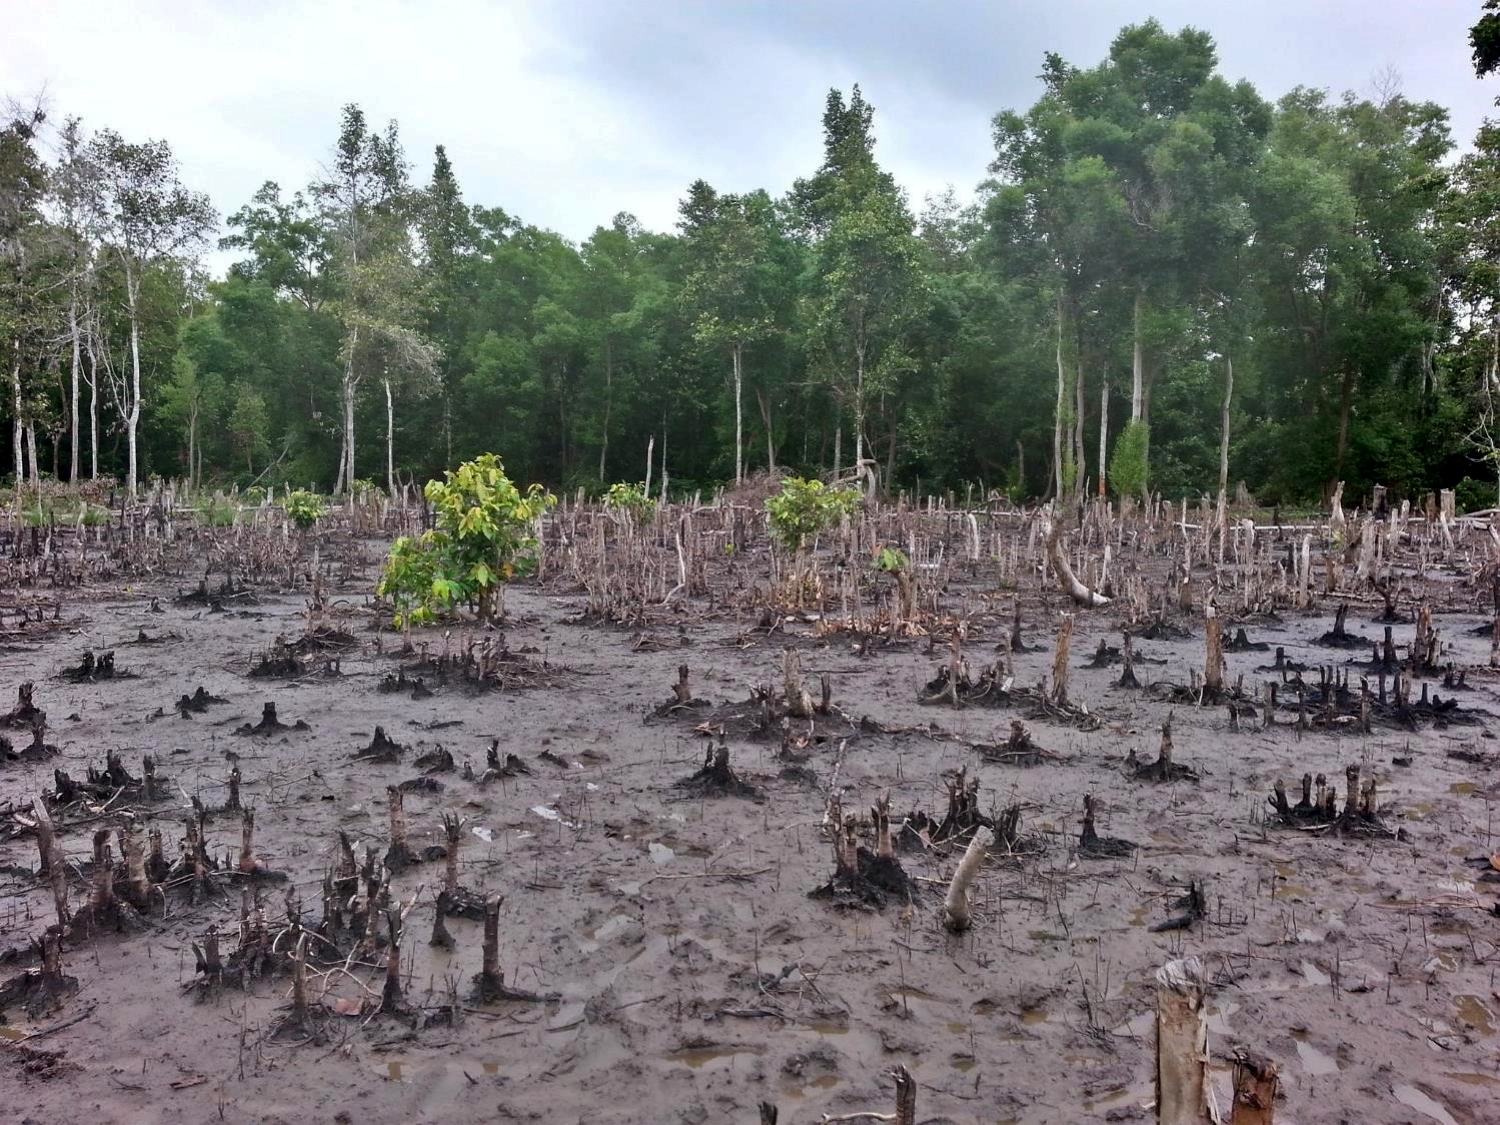
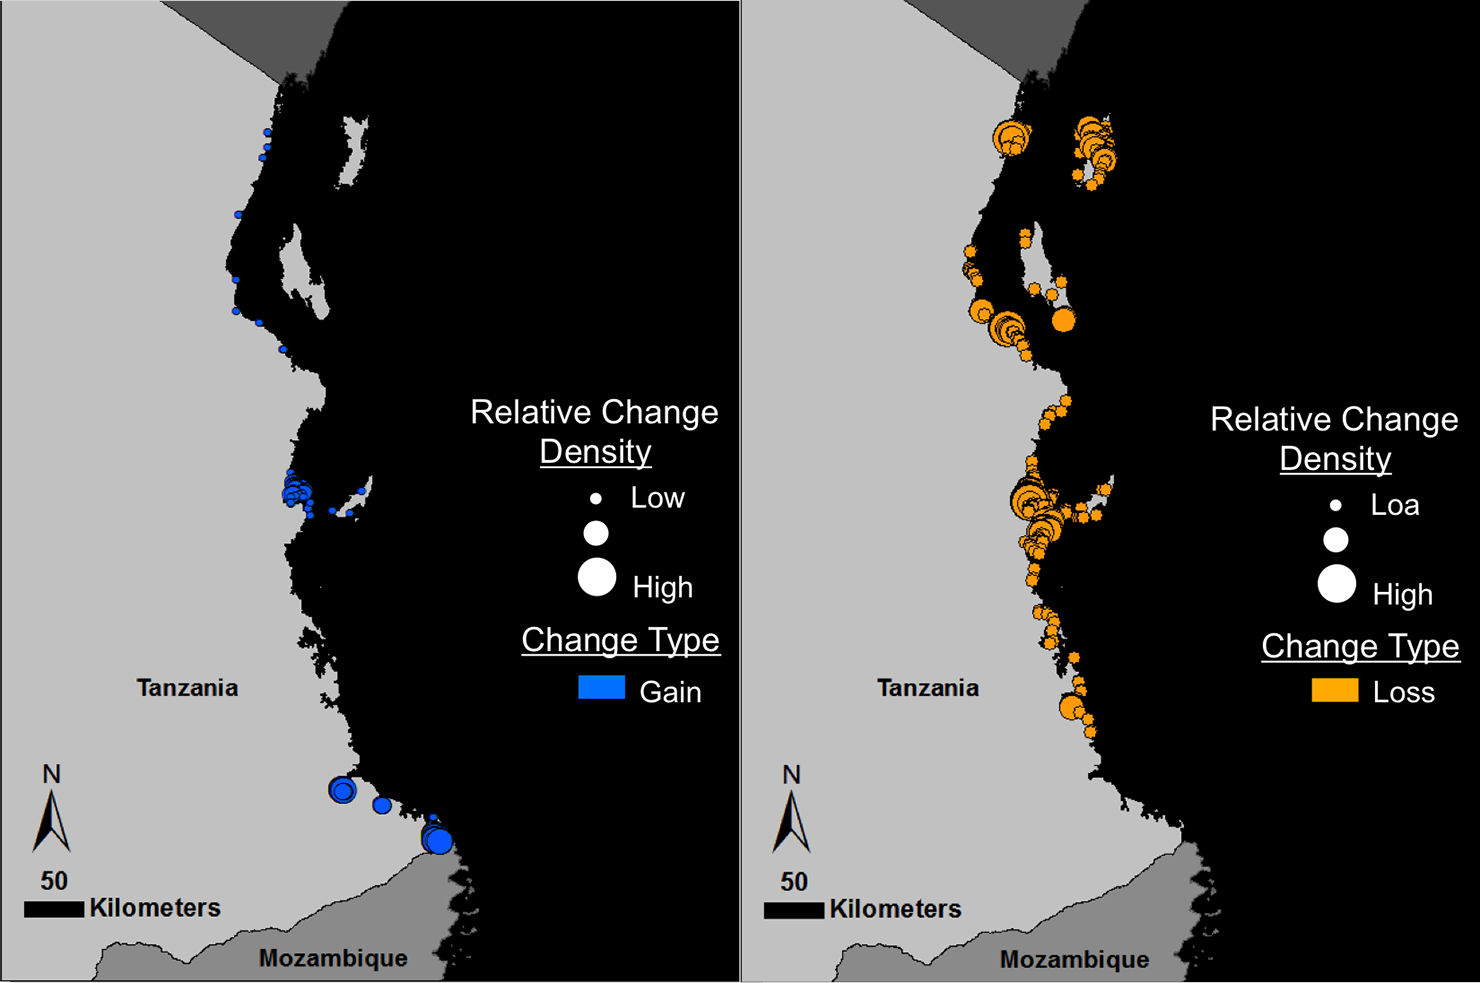
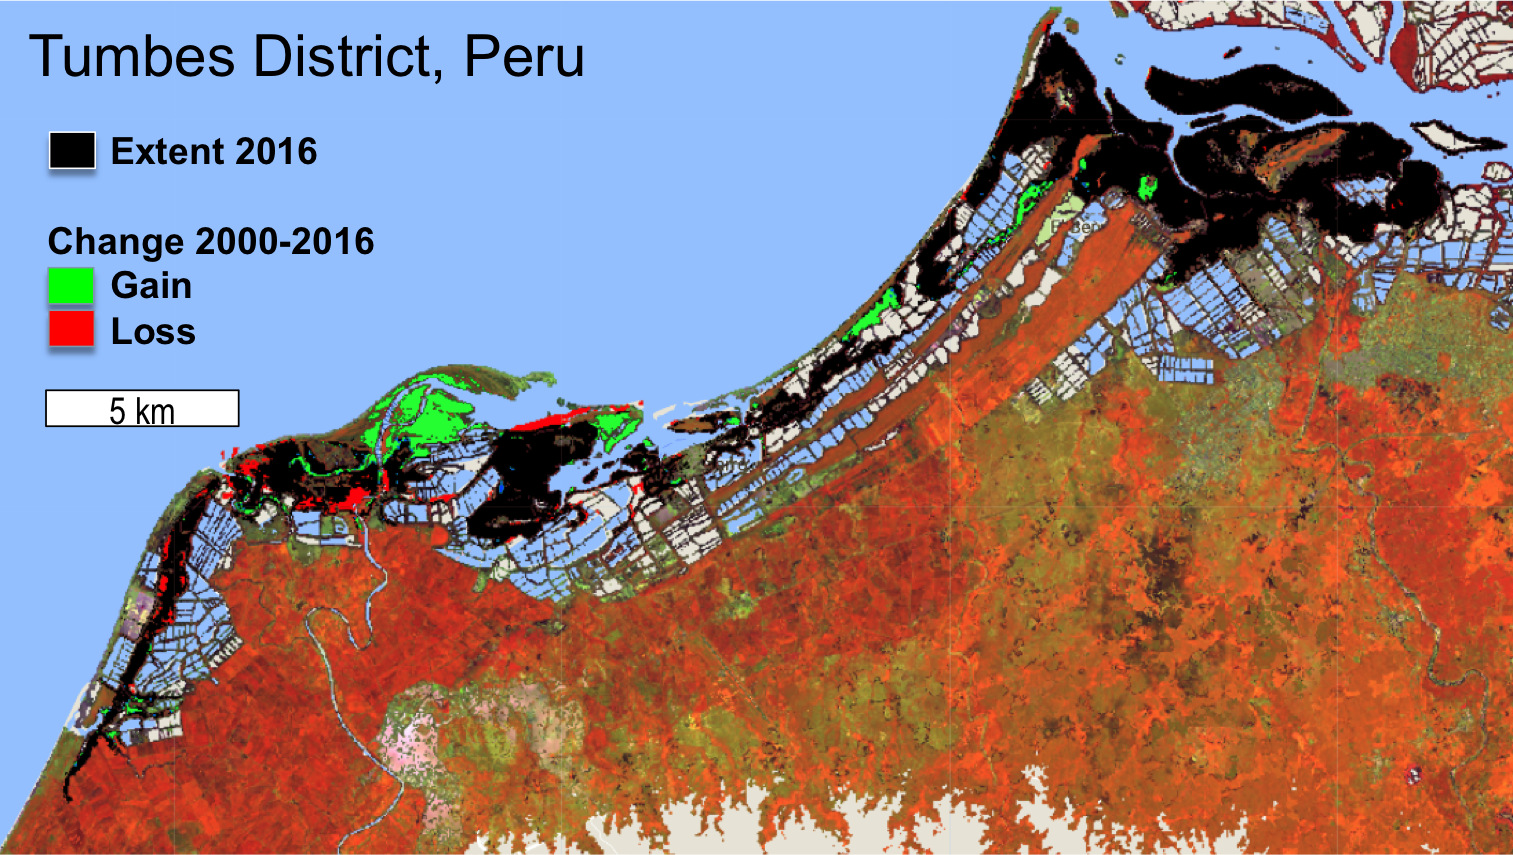
The area of mangrove wetlands around the world has been declining over recent decades. Much of the decline in mangrove area is a direct result of the expansion of urban areas and agriculture into these wetlands. The rate of decline, globally, hovers around 1-2% loss per year. However, many of these estimates in mangrove loss have not considered the natural regrowth or pioneering of mangroves that occur in many of these coastal regions. Our findings show that these areas of mangrove expansion into mudflats can help to offset the mangrove areas lost to human development or natural losses (erosion). Some countries, like Peru and Mozambique, are actually seeing a net gain of mangrove area as a result of these newly vegetated mudflats.
What are the implications of your findings?
Natural mangrove expansion is an often overlooked mechanism that can compensate for a significant portion of mangrove loss. By incorporating both the losses and gains we can do a much better job at measuring changes to regional and global carbon budgets. In addition, the spatially-explicit information that we are gathering on the “hotspots” of mangrove change is important for properly managing and restoring these ecosystems so that resources can be allocated more effectively.
What role did Landsat play in your investigation?
Tropical coastal regions can be extremely cloudy. Through strategic filtering and masking of Landsat’s image archive we are starting to use every “good pixel” regardless of the cloud cover in the image to look at changes to the landscape. This process has allowed us to measure both the gain and loss of mangroves with high accuracy in many areas around the world. In addition, the 30 meter spatial resolution is perfect for measuring these changes to mangrove forests because these environments are usually found in relatively thin bands (1 to 100km) along tropical and subtropical coasts.
Co-authors:
David Lagomasino
University of Maryland College Park
Temilola Fatoyinbo
NASA GSFC
Seung-Kuk Lee
NASA Goddard Space Flight Center
Emanuelle A Feliciano
NASA Goddard Space Flight Center
Carl Trettin
US Forest Service Cordesville
Funding provided by NASA Carbon Monitoring Systems, NASA New Investigator Program, and NASA/USDA Carbon Cycle Science
Anyone can freely download Landsat data from the USGS EarthExplorer or LandsatLook.
Further Reading:
+ Landsat at #AGU17

Be Part of What’s Next: Emerging Applications of Landsat at AGU24
Anyone making innovative use of Landsat data to meet societal needs today and during coming decades is encouraged to submit and abstract for the upcoming “Emerging Science Applications of Landsat” session at AGU24.


