By Laura E.P. Rocchio
This evening at #AGU16, Benjamin Sleeter, a geographer with the USGS Western Regional Offices in Menlo Park, gave a talk on his work looking at 45 years of land use and land cover change in the conterminous U.S. He also presented his calculations showing how those changes have impacted carbon storage. We had the opportunity to speak with Mr. Sleeter about his work:
Presentation Title
Estimating ecosystem carbon change in the Conterminous United States based on 40 years of land-use change and disturbance
What are the major findings of this research?
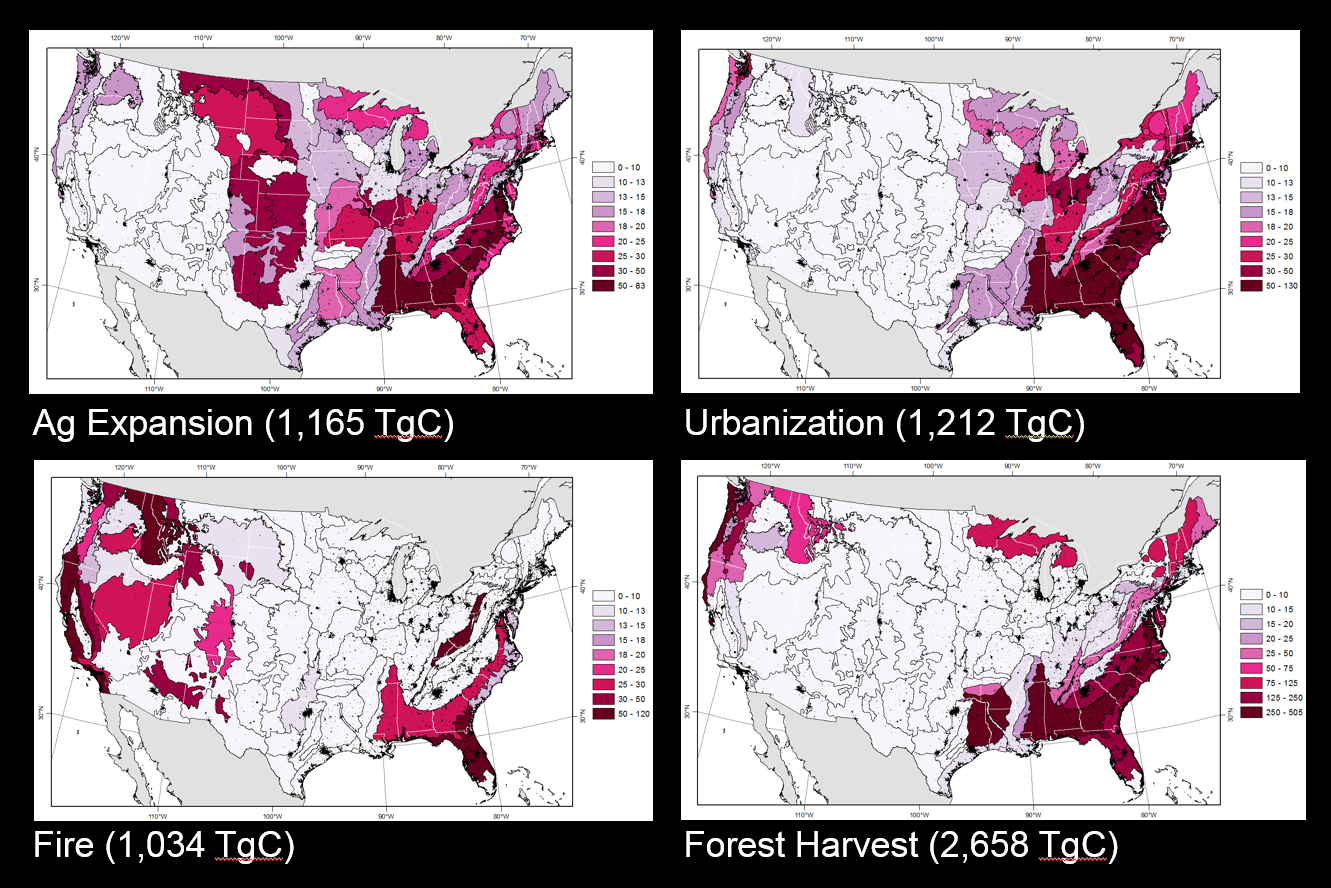
Our findings estimate the effect of 45 years of land use and land cover change on ecosystem carbon dynamics in the Conterminous United States. Using a range of time series data from the Landsat archive, we estimated the impacts of urbanization, agricultural expansion and contraction, forest harvest, and wildfire on ecosystem carbon storage and flux for each of 84 ecological regions between 1970 and 2015. Our findings show that nearly 6 billion metric tons of carbon were removed from terrestrial ecosystems over this time due to land use/land cover change and disturbance. These changes have contributed to a weakening of the carbon sink from approximately 452 million metric tons of carbon per year in the 1970s, to 303 million metric tons between 2010-2015, a decrease of ~33%. Over the same period, net primary production (NPP) was projected to increase by ~8.5%, partially offsetting carbon losses resulting from LULC change and disturbances.
What are the implications of your findings?
Implications of this study underscore the importance of considering the effects of land change and disturbance in carbon cycle research. Terrestrial ecosystems are important buffers against the impacts of climate change through the sequestration of atmospheric CO2. However, human alteration of ecosystems poses potential risks and may reduce the sequestration capactiy of ecosystems, which would in-turn have important feedbacks to the climate system.
What insight did you gain from Landsat that would have been impossible to glean otherwise?
The Landsat archive was used to provide estimates of land change and disturbance for this study. Specifically, we used data from the USGS Land Cover Trends research project which provided estimates of land change at the ecoregion scale for the period 1973-2000. These data were supplemented with data from the National Land Cover Database and the Monitoring Trends in Burn Severity project, which both depend on Landsat for their mapping efforts. Without the consistent, long-term temporal archive, a study such as this would not have been possible to carry out in a systematic and consistent way across the entire conterminous United States.
Did your team at USGS develop the Land Use and Carbon Scenario Simulator?
My team developed the Land Use and Carbon Scenario Simulator (LUCAS) as a way of providing an integrated modeling structure which can simulate changes in LULC and the corresponding impacts on carbon dynamics. The LUCAS model is based on the SyncroSim modeling platform, available from APEX Resource Management Solutions. LUCAS provides a graphical user interface which allows users of all levels to construct models and view results.

Co-authors:
Bronwyn Rayfield
APEX Resource Management Solutions
Jinxun Liu
USGS Western Regional Offices Menlo Park
Jason Sherba
USGS Western Regional Offices Menlo Park
Colin Daniel
University of Toronto
Leonardo Frid
Apex Resource Management Solutions
Tamara S Wilson
USGS Western Regional Offices Menlo Park
Zhiliang Zhu
USGS
Anyone can freely download Landsat data from the USGS EarthExplorer or LandsatLook.
Further Reading:
+ Landsat Abounds at #AGU16


