Next Year, North America; Someday, the World
Anderson and Kustas, along with NOAA colleagues Chris Hain and Xiwu Zhan, are also mapping ET over the entire globe at a coarser spatial resolution, working towards a day when the maps can be used worldwide for drought monitoring. The group has developed a website showing their drought-monitoring maps; the site will soon go public and be linked to the U.S. Drought Portal.
The work has advanced enough that the team wants to expand its drought monitoring to Mexico, Canada, and Central and South America. They are mapping parts of Africa—including the Horn of Africa region, where drought has caused famine in Somalia—with data from European Union meteorological satellites.
Anderson recently attended a conference in Ethiopia on soil moisture and drought monitoring to help subsistence farmers cope with increased weather variability. Scientists, Ethiopian government officials, and disaster-aid groups participated in the conference and showed great interest in the new water-use and drought-early-warning information that can be provided by satellite systems.
Use of ET for Drought Mapping
ET consists of the water evaporated from soil and plant surfaces and the water vapor that escapes, or transpires, through plant leaf pores (stomata) as the plants absorb carbon dioxide (CO2) through photosynthesis.
Anderson and Kustas and colleagues have simplified the estimation of ET by using measurements of land-surface temperature obtained from weather and research satellites. With this data, they can infer soil moisture without needing data on precipitation, soil characteristics, or anything else below the Earth’s surface. Anderson says that, “generally speaking, a cooler land surface is an indicator that ET is higher. Evaporation cools surfaces, so lower surface temperatures are typically associated with wetter soil and greater ET rates. In contrast, stressed vegetation exhibits elevated leaf temperatures, which can also be detected from space.”
Their ET maps can discriminate rivers, lakes, irrigated cropland, and wetlands based on the cooler surface temperatures. These maps are remarkably similar to those created by more complex hydrologic computer models requiring significantly more input data—which is often not readily available.
ALEXI Infers Soil Moisture
Anderson and Kustas feed the remotely sensed temperature data into their computer model, ALEXI (Atmosphere-Land Exchange Inverse), and it mathematically partitions the composite measurements into soil and plant temperatures. In turn, the equations use these component temperatures to make separate estimates of soil evaporation and plant transpiration. Soil evaporation estimates allow inferences about soil moisture in the first several inches of topsoil. Plant transpiration estimates do the same for soil moisture in the root zone, which can extend down to 3 feet or more, depending on plant type. Information about root-zone soil moisture is critical to farmers because it helps them decide how much and when to irrigate or how drought is likely to affect yields in dryland agricultural areas. These soil-moisture estimates can also be integrated into hydrological models to estimate total water losses and gains, accounting for factors such as runoff, drainage, and ground-water recharge.
Since 2000, ALEXI has been running daily, estimating ET over the continental United States. ALEXI’s accuracy has been shown to be within about 10 percent of measurements by surface- and tower-based instruments.
Dry is Normal in the West
Anderson explains that drought is monitored by detecting anomalies—so she and colleagues want to add ET anomalies to the monitoring process.
“It is dry in the American West, so that’s their normal, while greater moisture is the norm in the East,” Anderson says. “We’re looking for what is abnormal for a region, either drier or wetter than usual.”
To do this, they created an Evaporative Stress Index (ESI) by computing anomalies in the ratio of the “actual ET” estimated by ALEXI to the “potential ET,” which is the maximum ET that could be expected for a given region. This ratio gives a value from 0 to 1, with 0 indicating very dry conditions and 1 indicating wet or ample moisture for soil and plants. In a typical year, the ratio will be smaller in the West than in the East, but significant deviations from the typical ESI values in various regions provide a measure for detecting drought conditions.
“Drought detection is always in terms of percentage deviation from the norm in dryness or wetness for a region. In other words, will there be more or less rainfall than usual,” Kustas says. “This index tells us whether there is more or less ET than usual.”
Cross-Checking Their Methods
The scientists use coarse-resolution data from geostationary satellites to screen for drought stress and then take a closer look at stressed areas with high-resolution data from other satellites. Geostationary satellites appear motionless because they orbit at 22,000 miles above Earth’s equator. These satellites take snapshots of land-surface temperature conditions every 5 to 15 minutes.
Scientists at ARS, NASA, and Johns Hopkins University are testing the drought-mapping software side by side with traditional hydrologic mapping to see if the best parts of each method could be combined to improve regional water-budget estimates. Currently, they are comparing the two techniques to see how well each one estimates water usage along the full length of the Nile River.
“We want to see how closely the results from those two methods match, as a cross check,” Anderson says. So far, maps drawn from the two methods look very similar, but the remote-sensing approach gives better spatial detail, and it highlights regions of enhanced ET in irrigated and wetland areas that hydrologic models miss.
The ALEXI model mainly uses data from meteorological satellites, but it also receives data on vegetation cover from NASA’s Aqua and Terra satellites. ALEXI is coupled with a model that simulates the interactions of the lowest part of the atmosphere with Earth’s surface. These interactions affect soil evaporation and plant transpiration. For example, if the lower atmosphere is dry and the land surface wet, ET will increase.
Two Sources are Better Than One
Anderson was a researcher at the University of Wisconsin-Madison (UW-M) in the 1990s, working with John Norman, a professor with expertise in soil-plant-atmosphere computer modeling and agricultural remote sensing. Anderson joined Norman in working with Kustas on developing ALEXI.
Kustas said that “at a time when the ability to estimate ET using remotely sensed surface temperature was being discredited, Norman came up with a new approach, a unique two-source modeling framework, that converted many skeptics.” The two-source model estimates contributions of water, energy, and temperatures from both the soil and vegetation components of the land surface. ALEXI is built on this two-source framework, but extends its application to a regional scale.
Norman, Kustas, and colleagues worked for more than two decades to develop the surface temperature-based techniques for estimating ET. But, Kustas says, it is Anderson “who has carried ALEXI from a research tool to an operational system that can serve as a practical tool for ET and drought monitoring.”
Evaluating ALEXI Model Formulations
Since 1987, there have been studies evaluating different modeling components used in ALEXI as part of large-scale remote-sensing field experiments throughout North America. These studies have yielded a vast reservoir of data across various landscapes, from desert to tall-grass prairie to crop fields, forests, and bare land.
Many of these campaigns focused on testing microwave sensors that detect Earth’s natural microwave emissions from land for direct measurements of soil moisture. Wade Crow, an ARS physical scientist at Beltsville, is researching ways to blend microwave with thermal data currently used by Anderson and Kustas, looking to take advantage of the best features of each method.
In more recent field studies, they tested their thermal technique over cotton fields in the Texas Panhandle. They have also applied it in the Everglades of southern Florida, working with the South Florida Water Management District. Both regions are examples of areas where water managers and farmers urgently need the type of daily high-resolution ET and soil moisture availability estimates the ALEXI-satellite package promises to deliver.
For the Texas remote-sensing campaign, Kustas and Anderson worked with Paul Colaizzi, Prasanna Gowda, and Steve Evett to evaluate and refine major remote-sensing-based ET models for arid and semi-arid regions. Colaizzi and Gowda are agricultural engineers, and Evett is a soil scientist in the ARS Soil and Water Management Research Unit in Bushland, Texas. The experiment, led by Evett and Kustas, involved four ARS labs and several universities.
Weighing lysimeters at Bushland measure crop water use through changes in the weight of 100-square-foot blocks of soil perched on underground scales. These measurements provide “ground truth” data for testing ET estimates from ALEXI and other models.
“The ALEXI model allowed us to scale these point measurements up to regional water-use estimates,” Kustas says. Typically, regional ground-based networks of ET weather stations are too sparse to support operational decision making. Consequently, satellite imagery is likely to be the only viable source for routine ET estimates.
Evett sees many future uses for satellite remote sensing of ET, particularly for water-district management and policy-making on water issues.
Irrigation Scheduling from Space
In the long run, Anderson and Kustas hope to provide local ET data for use in irrigation scheduling, just as is currently done from field weather stations. But the data from satellites would be for individual farm fields, rather than from the nearest field station, so it would more accurately reflect local conditions. This will be especially helpful in places where there are no extensive networks of field weather stations, such as Africa.
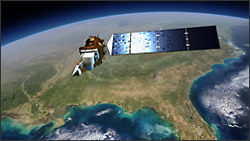
Still, getting routine ET estimates for individual fields from satellites is laborious at this point, Anderson says. She and Kustas hope to streamline the process for operational use. And they’re counting on new satellites with high-resolution thermal sensors to improve the timeliness of satellite imagery. The Thermal Infrared Sensor on the Landsat Data Continuity Mission, scheduled for launch by NASA in January 2013, will be critical to moving toward routine mapping of ET at field scale.
More and More Uses
Besides drought monitoring, water management, and irrigation scheduling, uses of the ALEXI/satellite package include crop yield prediction. “If crops suddenly show stress, we can ask whether that will affect yield, which will depend on the crop and whether it’s in a critical growth stage when drought occurs,” Anderson says.
Another use is in weather forecasting. Differences between land and air temperatures have major effects on weather, including spawning convection and thunderstorms. “With 5- to 15-minute readings from the geostationary satellites, we can monitor the changes in land and air temperatures as the sun rises. Since heat transfer from the land surface is largest around noon, late morning to early afternoon is when there is the greatest potential for turbulence caused by the temperature difference between land and air,” Anderson says.
In addition, remotely sensed ET and soil moisture maps can also be assimilated into meteorological models, potentially improving short-range weather forecasts. John Mecikalski, with the Atmospheric Science Department of the University of Alabama at Huntsville, is using ALEXI heat-flux estimates to eventually forecast where thunderstorms may develop 1 to 6 hours in advance. This is likely to improve flood forecasts and the prediction of severe weather outbreaks, as well as have benefits for air travel. Previously with UW-M, Mecikalski was responsible for developing the prototype data infrastructure to implement ALEXI at continental scales.
Link to Carbon Cycle
Anderson says the next generation of ALEXI may also predict carbon fluxes, since there is a close link between Earth’s carbon and water cycles. Both canopy transpiration and CO2 uptake are jointly controlled by leaf stomata, and therefore carbon assimilation and water use by plants can be tightly coupled. By modeling both cycles together, rather than separately, Anderson thinks we can do better at monitoring the nation’s carbon and water budgets. Satellite measurements of land-surface temperature will be a crucial model input, providing valuable spatial information on the health of the crops and other vegetation that regulate water and carbon exchange across the landscape.—By Don Comis, formerly with ARS.
This research supports the USDA priorities of responding to climate change and promoting international food security and is part of Water Availability and Watershed Management (#211) and Climate Change, Soils, and Emissions (#212), two ARS national programs. Bill Kustas and Martha Anderson are with the USDA-ARS Hydrology and Remote Sensing Laboratory.
Source: Bill Kustas and Martha Anderson, Agricultural Research magazine
Further information:
+ A New Way To Map Drought and Water Use Worldwide, Agricultural Research

