
Here is what she shared with us:
Presentation Title
Landsat Time-Series Analysis Opens New Approaches for Regional Glacier Mapping
What are the major findings of this research?
We explored automatic algorithms for glacier mapping applications that exploit the temporal signatures in Landsat satellite time-series data. We present different examples of how to improve glacier mapping from these data based on robust methods.
The current methods of glacier mapping should be revisited to reduce the dependency on single, manually chosen satellite scenes.
What are the implications of your findings?
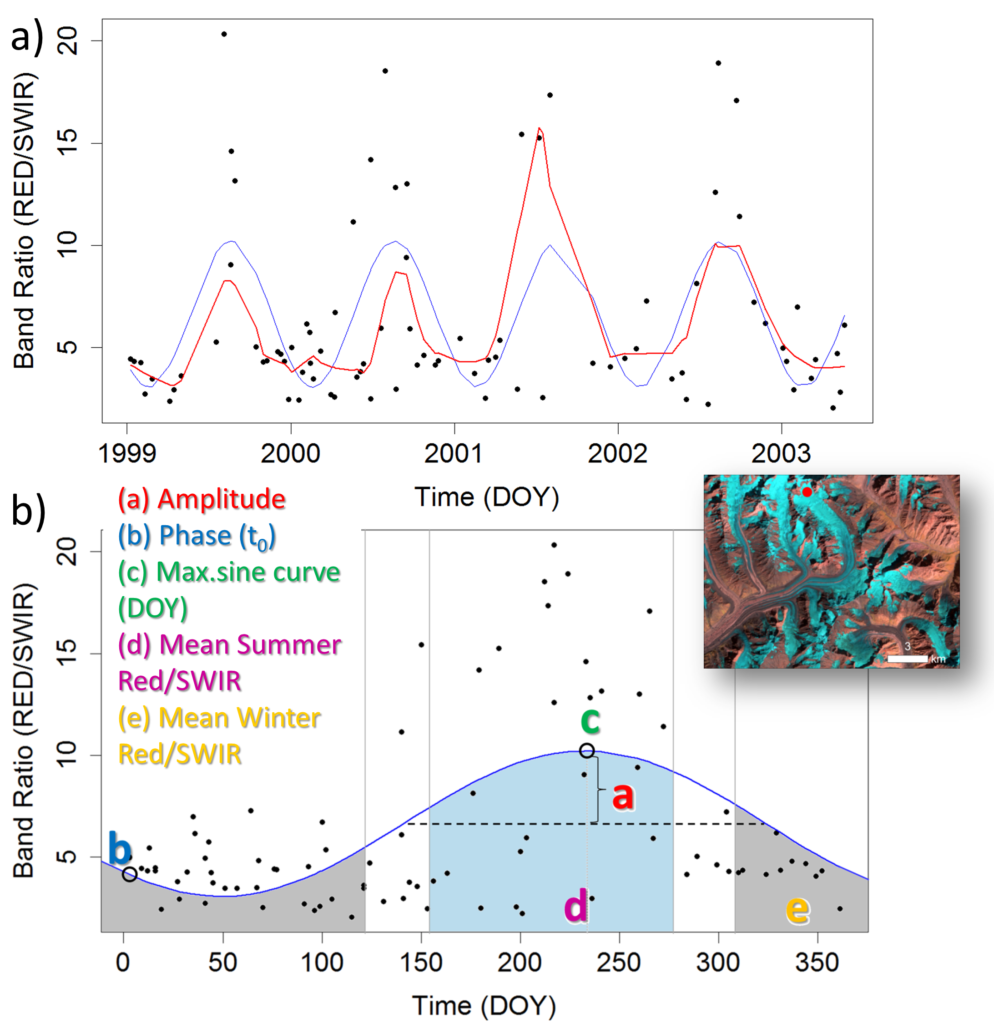
Our findings have implications for future glacier mapping methods. By fitting curves to dense optical time-series on a pixel basis, we found a potential for improved mapping of glacier outlines, due to seasonally spectral differences of snow and ice on glaciers (see figure).
This new way of exploring how we can map glaciers is important, since revisit times of multi-sensor optical satellite images will increase in the near future (e.g. Sentinel-2 A and B, in addition to Landsat 8).
What insight did you gain from Landsat that would have been impossible to glean otherwise?
Because of the Landsat images we were able to simulate higher temporal resolution by merging several years of data.
One of the main signals exploited from this was the seasonal spectral-temporal variation of SWIR reflectance over snow and ice, most likely due to snow metamorphosis (see figure). Additionally, the length of the Landsat archive is unique and is now comparable to a reliable climatological baseline period of ~30 years, which we highly benefitted from in our example of glacier change analysis.
What was your experience like working with both Landsat and Sentinel-2a? Were there any unforeseen challenges?
We find it challenging in high mountain areas to stack Sentinel-2 and Landsat 8 together on a pixel basis, due to different sensor orbits and different digital terrain models used in the ortho-rectification process causing a mismatch of pixel locations. This is especially an issue on glaciers due to thickness loss between the date of the DEM used for ortho-rectification and the image acquisition.
Co-authors:
Andreas Kääb
University of Oslo
Christopher Nuth
University of Oslo
Bas Altena
University of Oslo
Related reference:
Winsvold, S. H., Kääb, A., & Nuth, C. (2016). Regional Glacier Mapping Using Optical Satellite Data Time Series. IEEE Journal of Selected Topics in Applied Earth Observations and Remote Sensing, 9(8), 3698 – 3711.
The study was made possible by the European Union (European Research Council), ESA Glacier CCI, and Copernicus Glacier Service Norway.
Anyone can freely download Landsat data from the USGS EarthExplorer or LandsatLook.
Further Reading:
+ Landsat Abounds at #AGU16


