By Sofie Bates, NASA’s Goddard Space Flight Center

December 08, 2020 • COVID-19 has changed the way we live and work, as various health and safety restrictions keep more of us at home more often. The resulting changes to our behavior are already impacting the environment around us in myriad ways, according to comparisons of remote sensing data before and during the pandemic collected by NASA, U.S. Geological Survey (USGS), and ESA (European Space Agency) Earth-observing satellites and others.
Researchers from several institutions presented their early results in a virtual press conference on Dec. 7 at the American Geophysical Union’s 2020 fall meeting. They found that the environment is quickly changing, and the timing of those changes seems to indicate that the pandemic may be a reason. Deforestation rates are changing in some places, air pollution is diminishing, water quality is improving, and snow is becoming more reflective in some areas since the pandemic began earlier this year.
“But we will need more research to clearly attribute environmental change to COVID,” said Timothy Newman, National Land Imaging Program Coordinator for the United States Geological Survey (USGS).
Scientists and engineers like Newman use remote sensing data to observe how the world is changing during the COVID-19 pandemic, comparing current remote sensing data to pre-pandemic trends. Newman’s program monitors weekly changes with satellite images from the joint NASA/USGS Landsat satellites and the ESA’s Sentinel-2 satellites.
Shifting Rates of Deforestation
Newman’s program observed that large swaths of the Brazilian Amazon rainforest were cleared from June to September of this year, since the start of the COVID-19 pandemic. Rapid deforestation also is occurring in the tropics near Indonesia and the Congo. Yet, in other parts of the Amazon rainforest such as Colombia and Peru, deforestation appears to have slowed somewhat since the onset of the pandemic.

Bright White Snow
Satellite images and data from Landsat also show a reduction in environmental pollution in this time period. Industrial activities in India, including extracting and crushing stone for construction projects, slowed or ground to a halt because of COVID-19 lockdowns. Soon after, surface air measurements and Landsat thermal infrared data showed that air pollution levels had dropped significantly. One study found that the concentration of an air pollutant called particulate matter (PM) 10 decreased around a third to a fourth of the pre-pandemic level in India.
For years, Ned Bair has been studying snow in the Indus River Basin – a network of mountain ranges and rivers near India, China, and Pakistan that supplies water for more than 300 million people.
“Once the COVID-19 lockdown started in India, I immediately thought that it would have an impact on the snowpack,” said Bair, a snow hydrologist with the University of California Santa Barbara’s Earth Research Institute.
Bair saw posts on social media about how clear the air was in Delhi and preliminary data that air quality was improving during the pandemic. With less pollution in the air, he thought, there would be less dust and soot accumulating on nearby snow. Dust and other air pollutants affect snow albedo – how white and, therefore, reflective the snow is – as they accumulate on the surface of snow. Cleaner snow has a higher albedo, which means it reflects more light energy and, thus, melts at a slower rate.
Bair and his team found that snow albedo was higher during pandemic-related lockdowns than in the 20 years prior – likely a result of the significant reduction in travel and industrial activity as fewer people were leaving home and workplaces were shut down or reduced operations.
They used data from the Moderate Resolution Imaging Spectroradiometer (MODIS) instrument aboard NASA’s Terra satellite, and two computer models to filter out clouds, rocks, trees, and anything that wasn’t snow. Both models showed that snow in the Indus was significantly cleaner during the COVID-19 lockdowns. Using dust to approximate all pollutants, the models showed that pollutants accumulating on the snow decreased by 36 parts per million below the pre-pandemic average – a change that could delay the melting of enough snow to fill up Lake Tahoe Dam in California, or about 0.17-0.22 cubic miles (0.73- 0.93 cubic kilometers).
Snowmelt is an important source of drinking water for more than 300 million people living in the Indus River Basin. While changes in albedo won’t change the overall amount of snowmelt, it will change the timing of when that snow melts – potentially affecting the available water supply in the region.
Better Water Clarity
Nima Pahlevan, a research scientist at NASA’s Goddard Space Flight Center, dove into examining the pandemic’s impact on water quality around the world. He looked at Landsat-8 and Sentinel-2 data on water quality by analyzing proxies like chlorophyll-a, solid material suspended in the water, and turbidity – essentially a measure of how clear water is based on things like suspended particles of inorganic sediment or phytoplankton in the water – during the pandemic and compared those measurements to years prior.
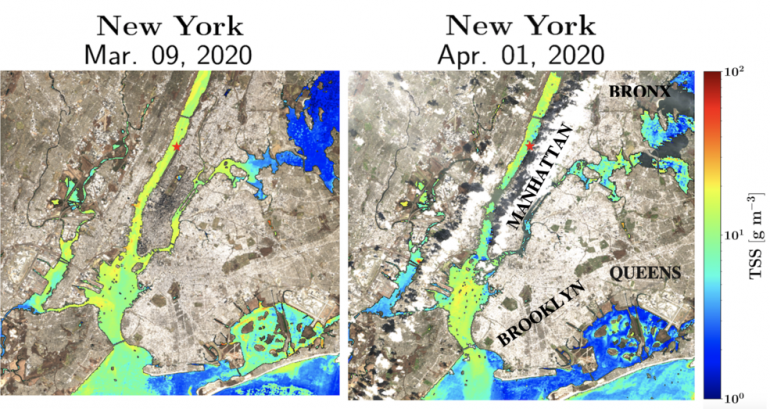
The findings were murky in some areas. For example, in San Francisco, California changes in rainfall made it difficult to tell whether the pandemic impacted water quality. But a clearer picture surfaced in the western Manhattan area of New York City.

different levels of total material suspended in the water.Image credit: Nima Pahlevan, NASA
“The water has become clearer in the western Manhattan area because there were fewer people commuting to Manhattan during the lockdown,” he explained.
Sewage water from homes and businesses, as well as runoff from streets, are treated in wastewater treatment plants before being released into nearby rivers. When the city imposed a stay-at-home order in mid-March, many of Manhattan’s 2.1 million commuters began working from home or left the city. Fewer people producing those pollutants means that fewer particles end up in the water in the Hudson River. Satellite data showed a more than 40% drop in turbidity during the pandemic in a section of the Hudson River.
The better water quality probably won’t last, though, Pahlevan says. Once we return to pre-pandemic behaviors, water quality will revert as well. Many of the environmental improvements that researchers are seeing won’t last if the world goes back to its pre-pandemic ways.
For more insight into how the environment is responding to changes in human behavior during the pandemic, see NASA’s COVID-19 dashboard.


