By Laura E.P. Rocchio
This afternoon at #AGU17, Dr. Kristin Byrd, a Research Physical Scientist with the USGS Western Geographic Science Center in Menlo Park, CA is presenting her work on modeling the aboveground biomass and carbon of tidal marshes across the U.S. Here is what she shared with us about her research:
Presentation Title
A forward-looking, national-scale remote sensing-based model of tidal marsh aboveground carbon stocks
What are the major findings of this research?
We were able to generate a single accurate and reproducible remote sensing model of tidal marsh aboveground biomass and carbon that represents nationally diverse tidal marshes within the conterminous United States (CONUS).
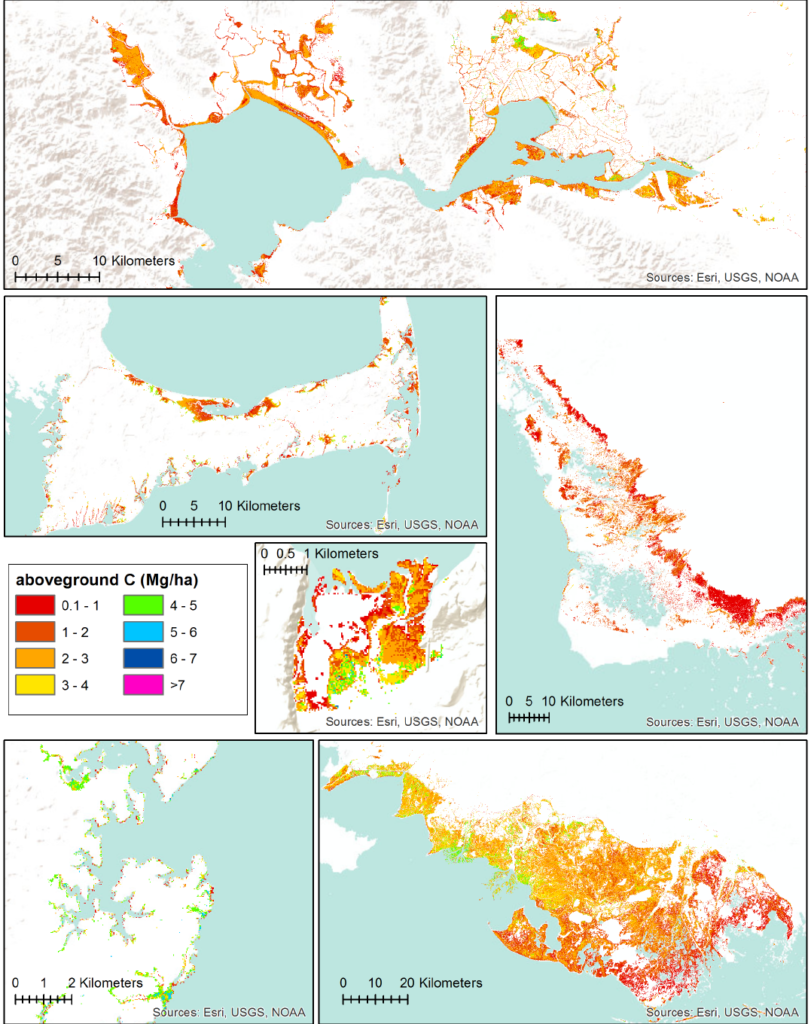
The final model, driven by six Landsat vegetation indices and with the soil adjusted vegetation index as the most important (n=409, RMSE=310 g/m2, 10.3% normalized RMSE), successfully predicted biomass for a range of marsh plant functional types defined by height, leaf angle and growth form. With a mean plant carbon content of 44.1% (n=1384, 95% C.I.=43.99% – 44.37%), we generated regional 30m aboveground carbon density maps for estuarine and palustrine emergent tidal marshes as indicated by a modified NOAA Coastal Change Analysis Program (C-CAP) map.
What are the implications of your findings?
This modeling and data synthesis effort will allow for aboveground C stocks in tidal marshes to be included for the first time in the 2018 U.S. EPA National Greenhouse Gas Inventory for coastal wetlands. With the increased availability of free post-processed satellite data, we provide a tractable means of modeling tidal marsh aboveground biomass and carbon at the global extent as well.
What insight did you gain from Landsat that would have been difficult to ascertain otherwise?
1) Given that NOAA’s C-CAP land cover maps are derived from Landsat, we could fuse carbon density values with land cover values at the same resolution and extents. Change in both of these features is needed for national greenhouse gas inventories.
2) Two of the six vegetation indices selected for the final model included SWIR bands – this information is useful for mapping biomass, and identifying water.
Why do you think the soil adjusted vegetation index the most important of the six vegetation indices used as biomass predictors in your model?
I don’t have a definite answer, but we used data from six different estuaries from around the country. Its possible that substrate reflectance values differed from one region to another, and SAVI helped to control for this background signal in the vegetation reflectance.

Co-authors:
Kristin B Byrd
USGS Western Regional Offices Menlo Park
Laurel Ballanti
USGS Western Regional Offices Menlo Park
Dung Nguyen
USGS Western Regional Offices Menlo Park
James Robert Holmquist
Smithsonian Environmental Research Center Edgewater
Marc Simard
NASA JPL
Lisamarie Windham-Myers
U.S. Geological Survey
Nathan Thomas
NASA JPL
This project was funded by NASA Carbon Monitoring System, USGS LandCarbon Program, and USGS Land Change Science Program
Anyone can freely download Landsat data from the USGS EarthExplorer or LandsatLook.
Further Reading:
+ Landsat at #AGU17


