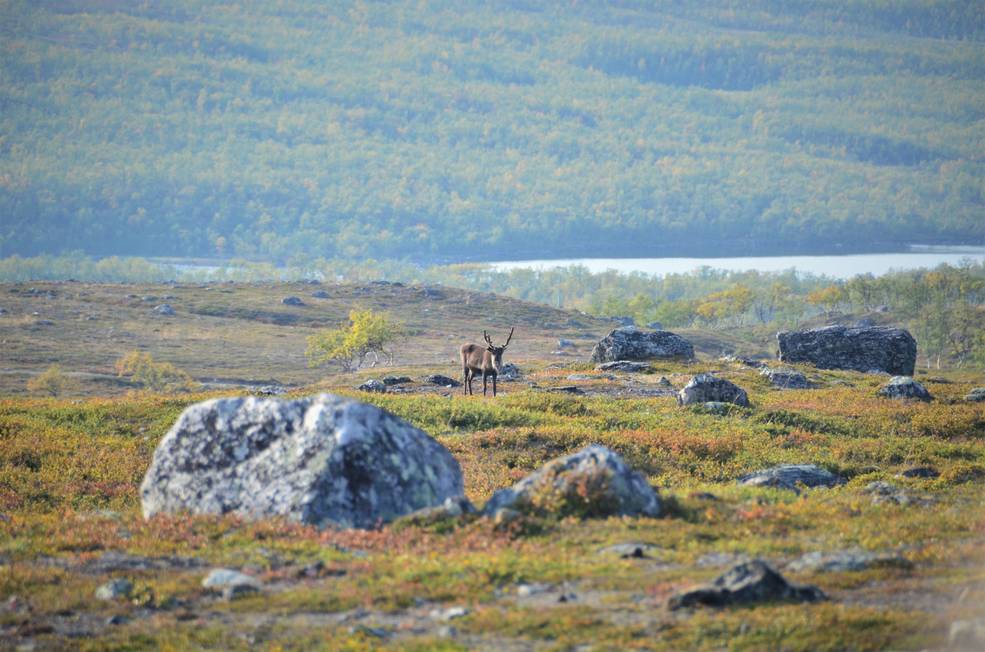
Warming Temperatures are Driving Arctic Greening
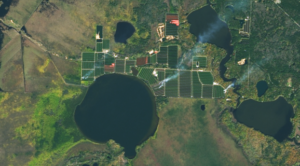
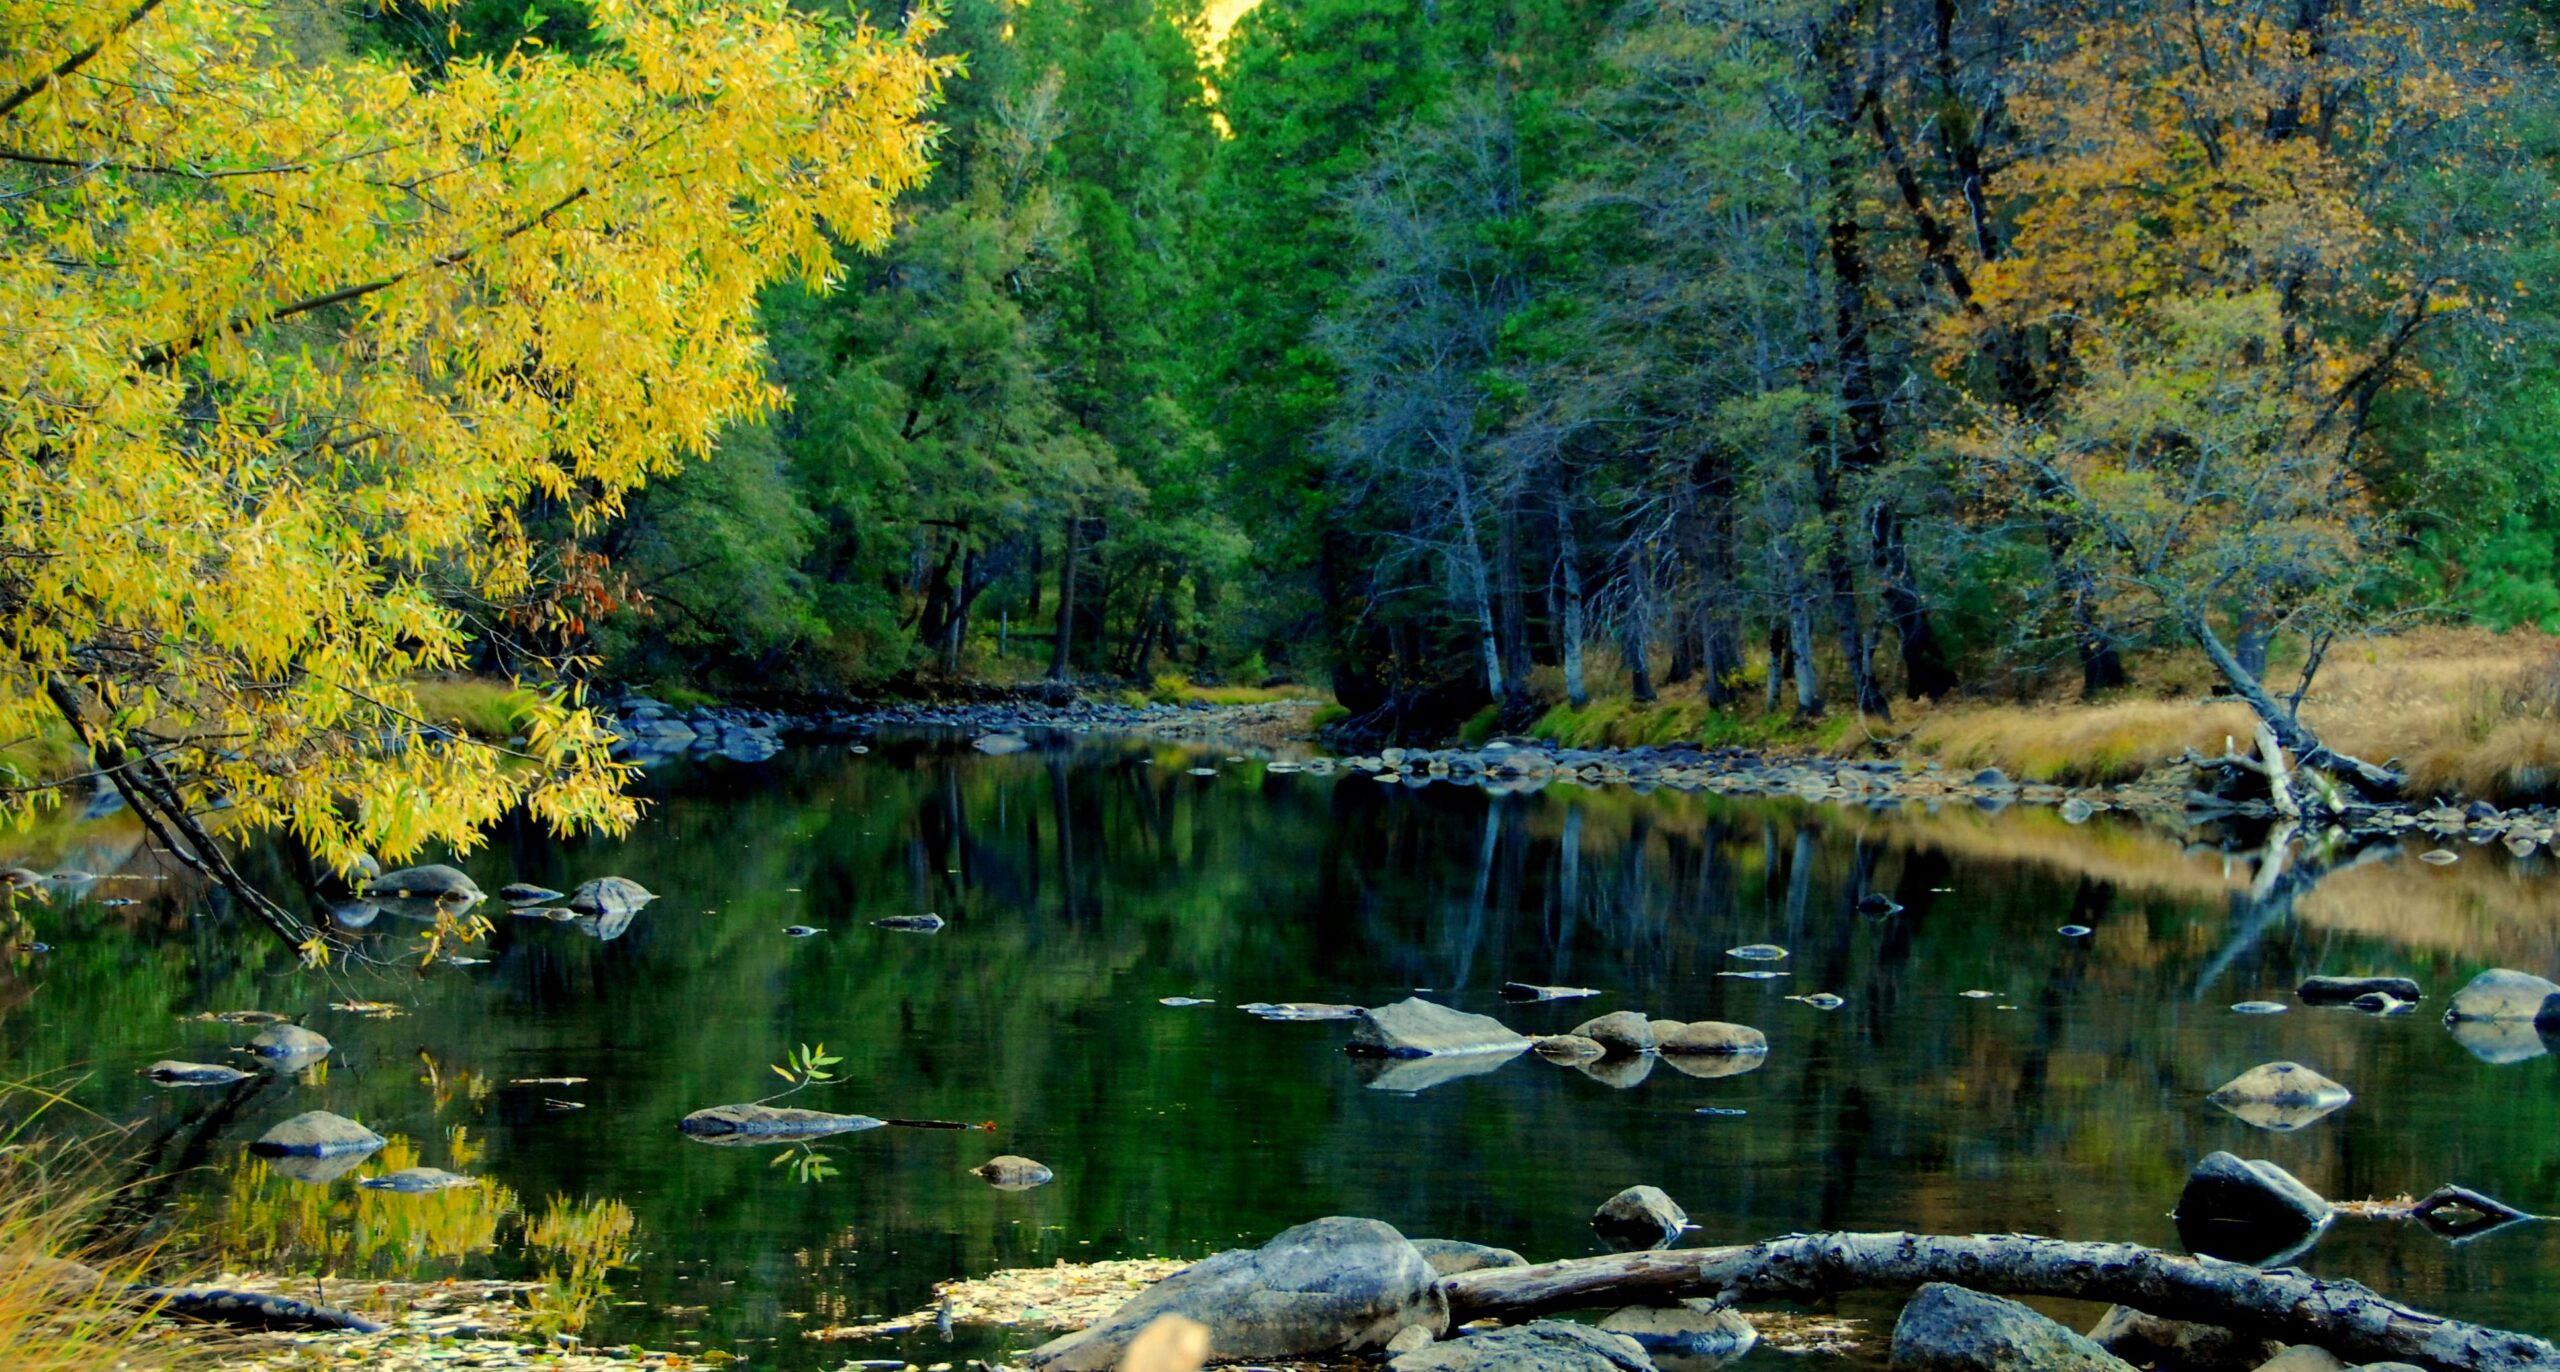
Using satellite images to track global tundra ecosystems over decades, a new study found the region has become greener, as warmer air and soil temperatures lead to increased plant growth.

Using satellite images to track global tundra ecosystems over decades, a new study found the region has become greener, as warmer air and soil temperatures lead to increased plant growth.

Using 30 years of Landsat data, researchers have found that the volume of glacial lakes worldwide has increased by about 50% since 1990.
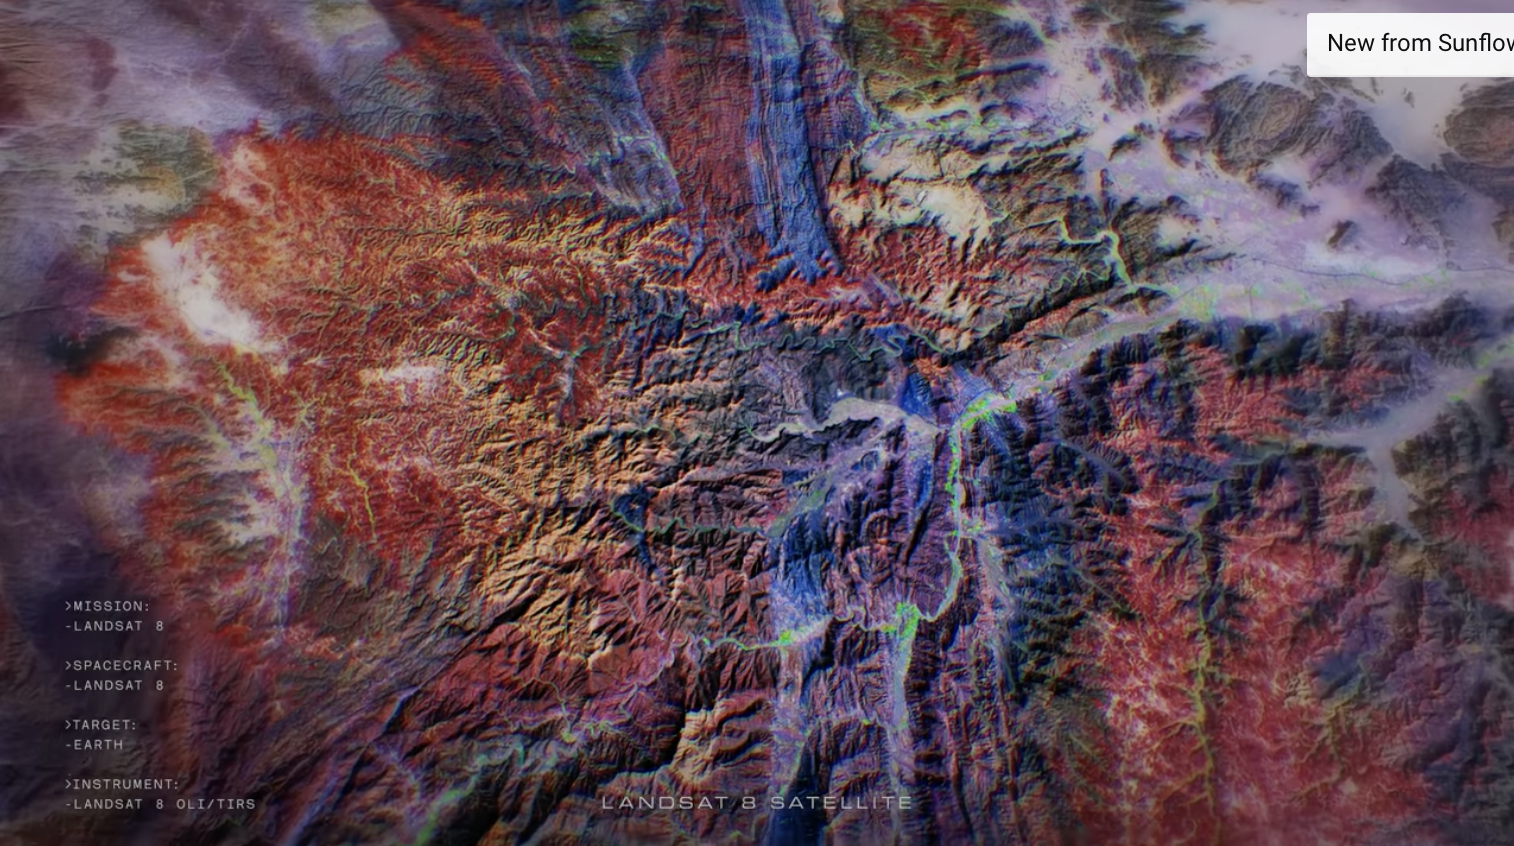
In Beck’s “Hyperlife” video, the abstract beauty of our planet morphs from geographic location-to-location with the flow of the etherial track.
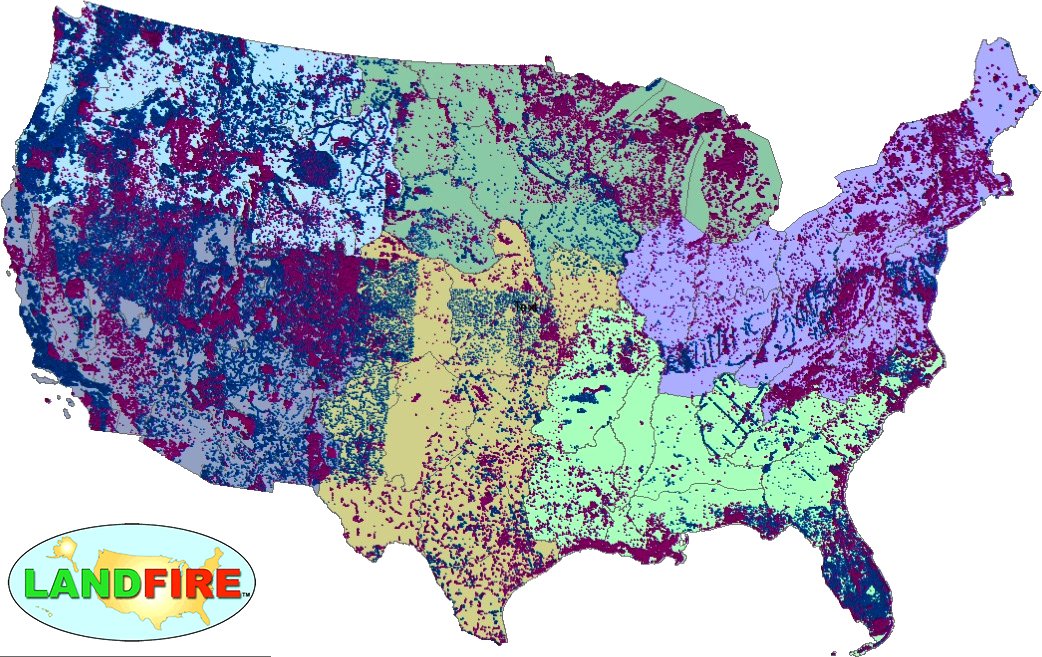
LANDFIRE has released its Remap dataset; new techniques and new data provide significant improvement.
The Food and Agricultural Organization of the United Nations published an audio article about using geospatial data, including Landsat, to monitor would agriculture on soundcloud.
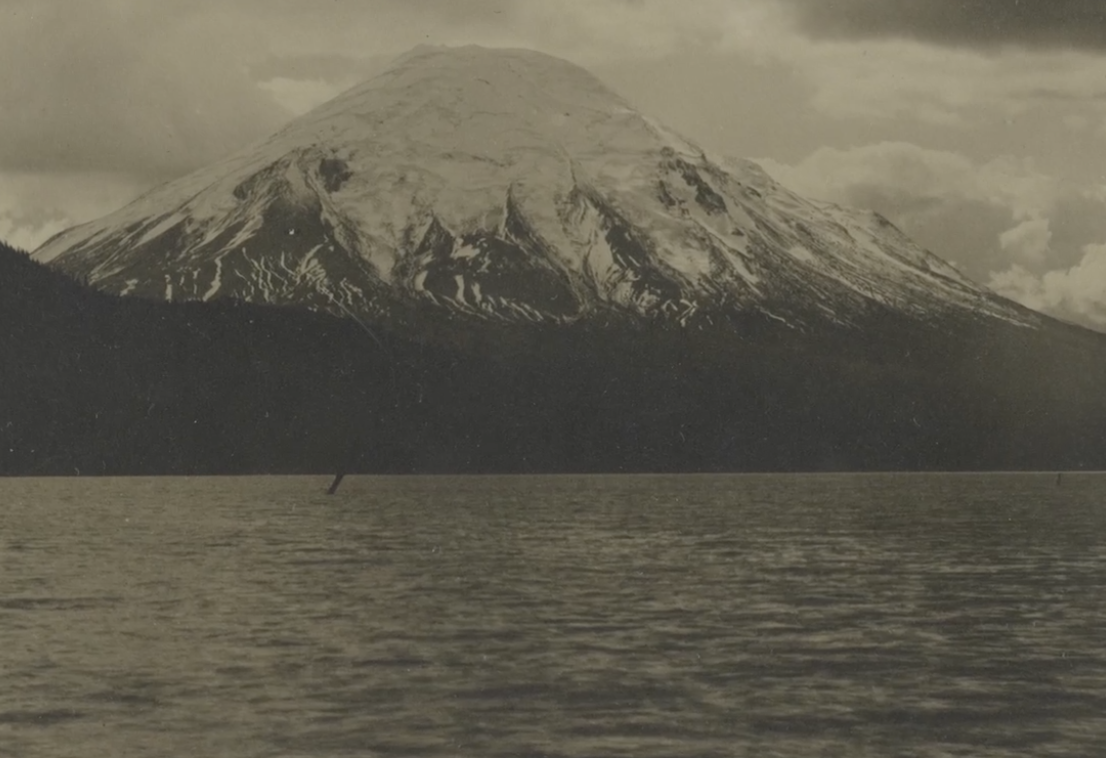
Landsat data (since 1972) is helping scientists Sean Healey and Zhiqiang Yang of the Rocky Mountain Research Station (U.S. Forest Service) study the long-term impact of the May 18, 1980, eruption of Mount St. Helens.
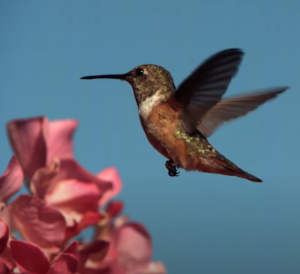
This bird’s-eye view of the relationship between temperature and bird biodiversity will help conservationists figure out where to prioritize their efforts in a warming world.
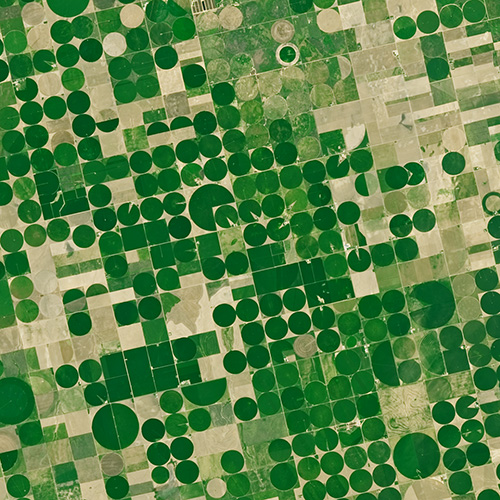
With Landsat data, farmers can find new ways to grow more crops with less water.
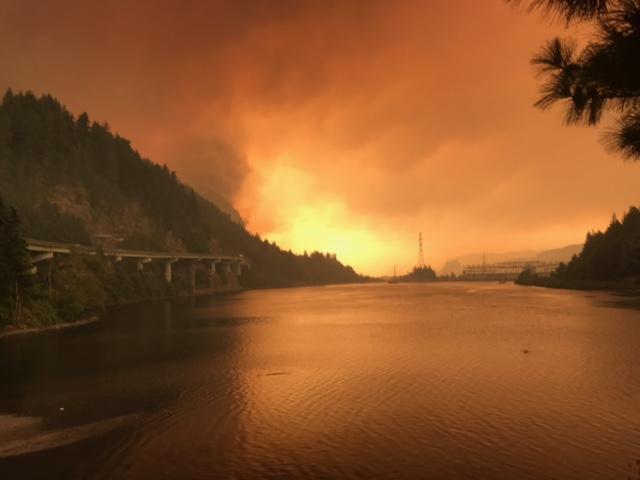
Fires in forested watersheds that support drinking water supplies can introduce contaminants that overwhelm current treatment capabilities. Earth observation data are helping.
Farmers across the Midwest are in a race to finish harvesting their corn, soybean, and other staples of the Thanksgiving dinner table before the first crop killing freeze sets in.
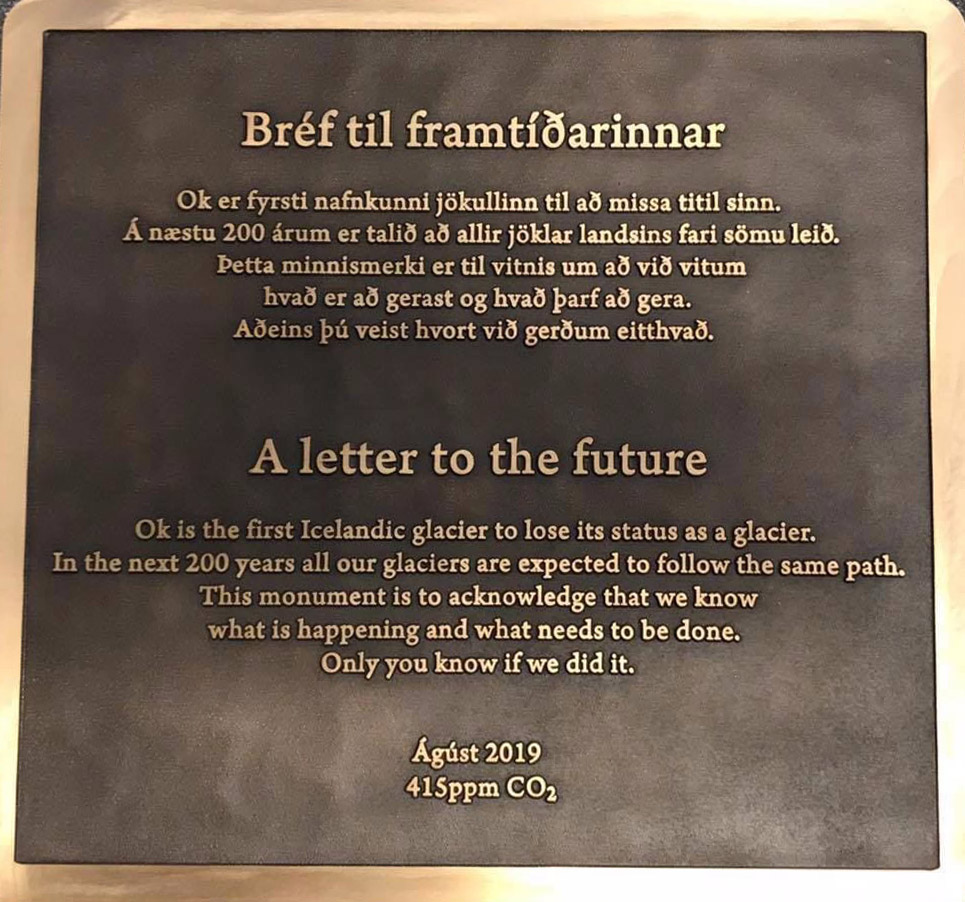
A memorial was placed on top of the volcano where Okjökull Glacier’s ice once flowed.
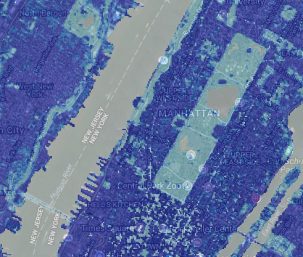
Two new Landsat-based data products and a mapping tool provide data on man-made impervious surfaces and urban extents throughout the world.
Using the technology inside your phone, you can help scientists classify land cover and track changes.
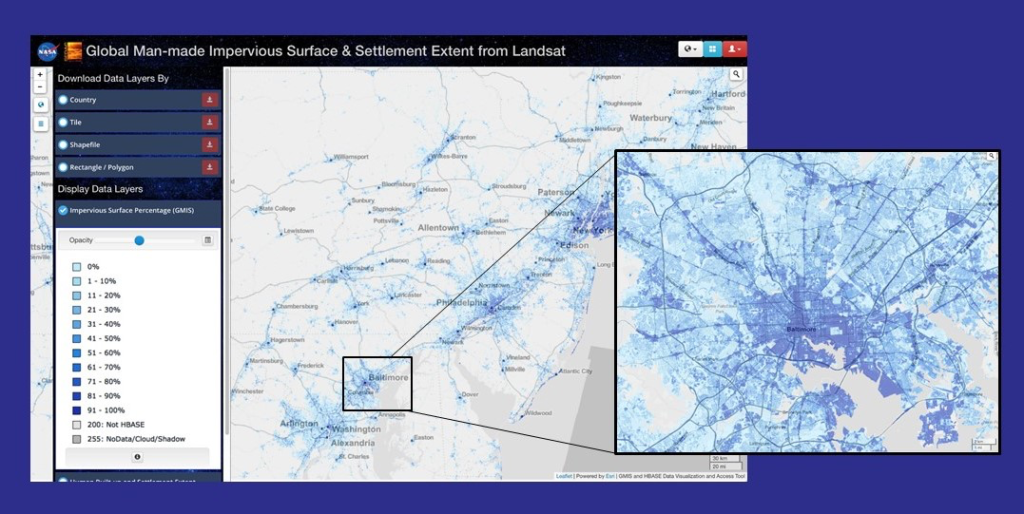
Webinar described the production of the Global Man-made Impervious Surface dataset and its companion urban extent dataset called Human Built-up And Settlement Extent.
Find out how Landsat imagery has been used by the National Water Census and in studying water use trends.
This project used Landsat 5 and Landsat 8 data to create land use maps to analyze change in riparian case study areas.
A combination of lightning, drought and human activity caused fires to scorch more than one-third of Yellowstone National Park in the summer of 1988.
Landsat sensor technology has come a long way since the days of the Return Beam Vidicon cameras on the first three Landsat satellites.
A ribbon-cutting ceremony for the new Landsat 7 Mission Operations Center (MOC) at the Goddard Space Flight Center was held this month.
As global temperatures rise, melting permafrost is expected to cause more frequent and hazardous landslides.
Annual maps of the lower-48 United States produced from Landsat satellite data illustrate how these dynamic systems changed from 1986-2010.
Landsat 9 Project Scientist Jeff Masek discusses the ways Landsat data is used and how important it is to have high quality data.
Patrick Hostert from the University of Berlin discusses the value of Landsat’s long archive to studying phenology.
Engineers and scientists from both Landsat and Sentinel missions talk about working together to calibrate observation data and validate its quality to improve the science using these resources.
Warren Cohen from the USDA Forest Service talks about the value of Landsat’s long history of observations in monitoring and assessing forests.
Landsat 8 continues a streak of engineering and science success unmatched in spaceflight.
Martha Anderson talks about the value of Landsat and its thermal data for understanding agricultural lands.
Leif Olmanson talks about the value of Landsat data for monitoring the thousands of lakes in Minnesota.
Barbara Ryan, Director of GEO talks about the distribution of Landsat data.
In this USGS Landsat in Action video Mike Wulder of Canada’s Forest Service talks about the value Landsat images have for mapping and monitoring Canada’s forested areas.
John Schott discusses using Landsat Data over the years and how its thermal data tracks temperature changes in water bodies.
Adam Lewis talks about the value of Landsat data, the importance of free and open policy, and how analysis ready data is advancing earth observing science.
Elmore delves into the changing phenology of forests and how that impacts the amount of carbon dioxide going into the atmosphere.
