Interview conducted by Joseph Smith, NASA EOSDIS / NASA EarthData
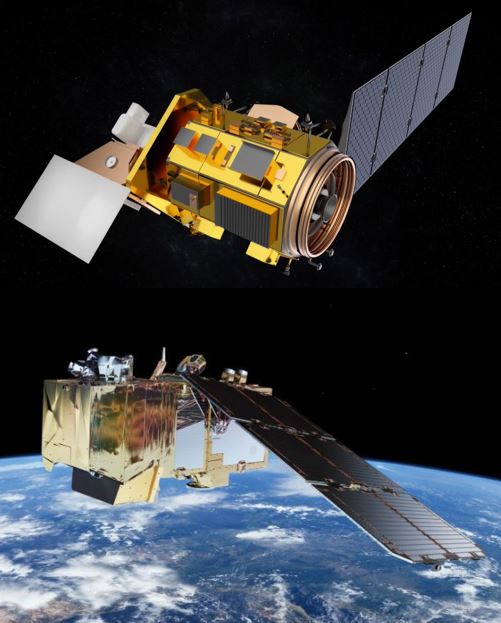
 March 31, 2021 • The Harmonized Landsat Sentinel-2 (HLS) project—which uses data from the joint NASA-USGS Landsat 8 and the European Space Agency’s (ESA) Sentinel-2A and Sentinel-2B satellites to generate a harmonized, analysis-ready surface reflectance data product available every two to three days—is an initiative of firsts. Its data products are the first to be used together, as if they come from a single instrument aboard the same satellite, and it is the first major Earth science dataset in NASA’s Earth Observing System Data and Information System (EOSDIS) collection hosted fully in the commercial cloud.
In the following interview, Dr. Jeff Masek, Principal Investigator on the HLS project, discusses the origins of the HLS project, the significance of the recent release of provisional HLS data, and what the project has in store for the future.
Can you discuss the impetus or need for the HLS product and how it came about?
We started the Harmonized Landsat Sentinel-2 (HLS) project around 2014, before the launch of ESA’s Sentinel -2 satellite, because there is just a general desire in the land science community for more frequent observations with the resolution that you get from a Landsat kind of system. We’re used to having daily data from MODIS (the Moderate Resolution Imaging Spectroradiometer instrument, aboard NASA’s Aqua and Terra satellites) or VIIRS (Visible Infrared Imaging Radiometer Suite instrument, aboard the joint NASA/NOAA Suomi National Polar-orbiting Partnership and NOAA 20 satellites), which is half-kilometer to one-kilometer resolution, but people discovered they could do a lot of the same science, but at the scale of fields and forest plots, individual blocks and cities, and so forth if they have the spatial resolution and daily data. We realized that, with Landsat, you only get an image every 16 days from one satellite and every 8 days from two satellites, which is what we usually have. Then we had the European Sentinel-2 System coming on, which offers data every 10 days from one satellite and every 5 days from two satellites. If you put these together, you have close to the daily observation scheme that people have been looking for. So, that was the impetus back in 2014, getting ready for the launch of Sentinel-2 and starting to think about putting these two data streams together and making it easy for users to do that.
As we were prototyping HLS data, the Satellite Needs Working Group (SNWG) came along. This SNWG is an interagency effort to collect the needs that federal agencies have for space-based, Earth observation data, present it to NASA and ask, “What can you do to help us collect this type of information?” In some cases, it’s sort of easy, low-hanging fruit because the data they need is already something we’re collecting and it’s just a matter of creating a new product or putting a couple of different [data] sources together. That was the case with HLS. The USDA said, “We would really like to look at within-year variation in crops and vegetation indices to assess crop type, and if we could put Sentinel-2 and Landsat together, that would be the ideal combination.” So, NASA said, “We’re already kind of working on that. Let’s accelerate that effort and expand it to a prototype with a global product.”
Beyond requesting data, what other roles did federal agencies played in the development of HLS?
The big partner in all of this is the USGS, because they provide the Landsat data. We’ve been working with them directly because they have a long-term interest in doing this kind of harmonization among datasets. In terms of consumers of the HLS data, the USDA is the big one because they need to be looking at crop status every few days to really track things. So, we worked with Martha Anderson and Feng Gao of the USDA’s Hydrology and Remote Sensing Laboratory in Beltsville, Maryland), which has been using the HLS product to inform its analysis of crop productivity through the growing season and make maps of planting date and initial emergence date, which is one of the variables that’s hard to get to from the existing satellite record.
In terms of collecting user needs, we engaged the USDA in various workshops and solicited user comments for the prototype stage before it got to NASA’s Earth Science Data and Information System (ESDIS) implementation, so we have a pretty good feeling about what people are looking for from that activity.

What is does the word “harmonized” in the name “Harmonized Landsat Sentinel-2” mean or refer to?
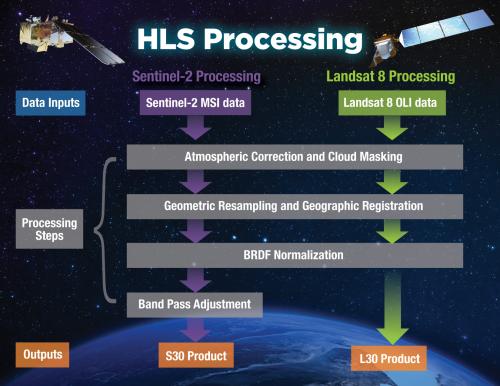
Harmonized in this sense means that the user shouldn’t be able to tell or care which satellite the observation came from. We don’t blend the two datasets. The Landsat-30-meter product (L30) and the Sentinel-2-30-meter product (S30), each one is descended from and individual Landsat or Sentinel-2 acquisition on that date, but we radiometrically and geometrically change the products so they look like each other and they overlay each other. So, we use a common tiling system, a common grid, common projection, and common resolution—30 meters—and then we do atmospheric corrections the same way for both and then we do a BRDF (Bidirectional Reflectance Distribution Function) correction to adjust for the different view angles, and we do a band-pass correction for the bands that are in common so that, to the greatest extent possible, they resemble the bands from the other sensor.
The release of this data is provisional. What does that mean?
As we’ve migrated to the global processing system, we’ve also updated some of the code base that we’re using for the atmospheric correction. Along the way we discovered a few anomalies when comparing what we were getting in version 1.4 to what we were getting in version 1.5 and so, until we had those anomalies resolved, we decided to do a provisional release so people could get use to the data format — the
Cloud Optimized Geotiff (COG) format — and the data. The discrepancies we found are small (one-percent of the total number of pixels), so the provisional product is perfectly usable, but we didn’t want to be in a position where people were doing land-change analysis and drawing statistical conclusions using data that we knew had some flaws in it. Those issues are pretty much resolved at this point, so we’ll go back and reprocess and release a science-quality version.
Are the data ever perfect?
That’s a good question. MODIS has now been going on for, what, 21 years, and they’re on collection 6? [Collection 7 is slated for release in spring 2021.] No, I think there is always room to improve the algorithms and the processing. What you hope doesn’t happen is that you don’t go backwards. I’ve seen a lot of cases where you fix one thing and, in fixing that, you break something else. What is important is that you benchmark the performance of any given set of algorithms, decide whether the discrepancies that are going to exist someplace are worth the risk of changing everything, and then re-benchmark once you do that change. It’s perfectly reasonable to think that you could reprocess almost indefinitely. I don’t think in HLS we have a plan to do that. We are planning to reprocess in the Spring, once the provisional goes to final, and then we may reprocess again in the future, but that depends on resources and need.
I read that it took several years to get to this point — the provisional release of the data. Were there unique challenges that programmers had to overcome?
Yeah, there were several challenges, although I think every project is unique in some way. On the science algorithm front, when we started, we were dealing with a satellite system — Sentinel-2 — that hadn’t launched yet and its data distribution program was still under development, so that was a challenge.
Another aspect has been the computational environment. We started this off using NASA’s Earth Exchange (NEX) at NASA’s Ames Research Center as a parallel computing platform to prototype HLS products back in 2016–2017. We then realized that to scale-up, NEX probably wasn’t the right environment. After talking with Kevin Murphy at NASA Headquarters, we elected to move to Amazon Web Services (AWS), commercial cloud platform. At that time (this was before the global implementation of HLS), we were still in our prototyping phase, so it fell to us on the Goddard science side to implement another version of HLS on AWS, and we did that through NASA’s Earth Science Technology Office (ESTO) Advanced Information Systems Technology Managed Cloud Environment (AMCE) program, which is a portal by which Principal Investigators can use AWS without affecting NASA’s data security processes. That was a challenge, and it took us a good year to get AWS up and running because our programmers are used to NEX and standard parallel computing and now here’s this cloud-computing paradigm that is totally different.
There’s been a third iteration [of HLS] since we’ve gone global, which is the implementation through the Interagency Implementation and Advanced Concepts Team (IMPACT) at NASA’s Marshall Space Flight Center. Brian Freitag and his team at Marshall took our AWS code and refactored it for use within the ESDIS-compliant AWS model. So, the processing is kind of out of our hands. We are the science leads, but the processing occurs at Marshall, so that transition has been challenging too.
HLS is the first major Earth science dataset in NASA’s Earth Observing System Data and Information System (EOSDIS) collection to be hosted fully in the commercial cloud. Why is that significant?
I would hope that for the users who access this data in the conventional way, that is, downloading it to their computer to mess with, that it would be transparent, as with any other dataset that NASA has. The commercial cloud, or the cloud in general, just opens some opportunities in terms of direct access through the cloud to the data. So, if you don’t want to download the data to your computer you can access it through your own cloud account on Amazon, copy it to your Amazon storage, and manipulate it there, which may be a more efficient way to analyze long time series of data. So, I think it opens some possibilities for users who want to be aggressive about bringing their algorithms to the cloud rather than the data back to their workstations. But, hopefully, for the users who want to access the data in the old-fashioned way and just bring one tile back to their workstation, it’s transparent.

It’s been said that this data has been long-desired by the terrestrial observation community. Why?
Like I was saying earlier, if you look at certain phenomena on the land—vegetation, crops, water resources—they can change quickly. You can get inundation events one week that are gone the next. So, there’s a general feeling that a robust land-monitoring system would get high-resolution data every day and that’s what people want to see for tracking short-term changes in vegetation and other phenomena. We haven’t had that at the resolution of Landsat. We had it at the resolution of MODIS, which is a kilometer or half-kilometer, but we haven’t had it at the 10-to-30-meter resolution, which is what we’re talking about with Sentinel-2 and Landsat.
This resolution is important because where you start to see individual fields, roads, buildings — the parcels of land that people own and can manage — is down at that 10-to-30-meter resolution. So, that’s kind of the impetus for it. If all you need to do is look at one clear image a year to look at long-term deforestation, for example, then HLS isn’t necessary for you. But if you want to look at changes that are occurring within a year, month-to-month, week-to-week, then HLS is a great tool, because it provides a lot of observations at that high resolution.
The temporal resolution or frequency is what we really improve with HLS, and by putting the Sentinel-2 and Landsat satellites together, that’s basically one observation every two to three days globally. Then, because the orbits of these satellites converge as you get to the poles, you get more frequent observations as you go higher in latitude toward the arctic, so there we’re up to at least one observation per day.
We’ve discussed the data available now. What’s can users expect the future?
Today, you have provisional products, which are available on a forward-processing basis, so available a couple of days after acquisition by the satellite, starting in late 2020, for both Sentinel and Landsat. What is going to happen next is that the provisional is going to get converted to final, hopefully in a month or two. We’ll reprocess that 2020 and 2021 data, so that will be out as a final data product, and we’ll continue with forward processing.
The big next step is to back process because, for this time-series data, what’s really valuable is having a multiyear record. You can’t say you’ve got an NDVI or drought anomaly unless you have several years of data to go back and say, “Okay, this is different from what
it has been.” So, we go back to 2013 and the launch of Landsat 8 with the same harmonized product. There’s no Sentinel to go along with it until 2015. So, the next step is to back process that 2013 to 2020 segment and, to be honest, we’re having some trouble getting a hold of older Sentinel-2 data, so that’s an ongoing discussion among NASA, USGS, and ESA. The intent is for that processing to happen by the end of 2021 and then we’ll have a complete HLS record.
Is there anything else about the HLS Project that you would like to share with our data users?
We are thinking about what we’re calling a “merged” or “M30” product. Instead of the acquisitions that occurred from any given sensor, we would provide a five or a 10-day composite period, pick the best observation from either sensor, and put it in there. This would be a single product that included observations from both instruments on a regular period. We’re working on that now, so that might be something to look forward to. Otherwise, I’d just encourage people to use the HLS product. It’s out there and I think for users who want a validated, scientifically sound surface reflectance product where they don’t have to think about which sensor it came from, it’s an ideal solution.
Explore HLS:
Discover and access HLS provisional products at NASA’s Land Processes Distributed Active Archive Center (LP DAAC) or explore HLS imagery layers in NASA Worldview.
Related Listening:
+ USGS Eyes on Earth Episode 45 – Harmonized Landsat-Sentinel


