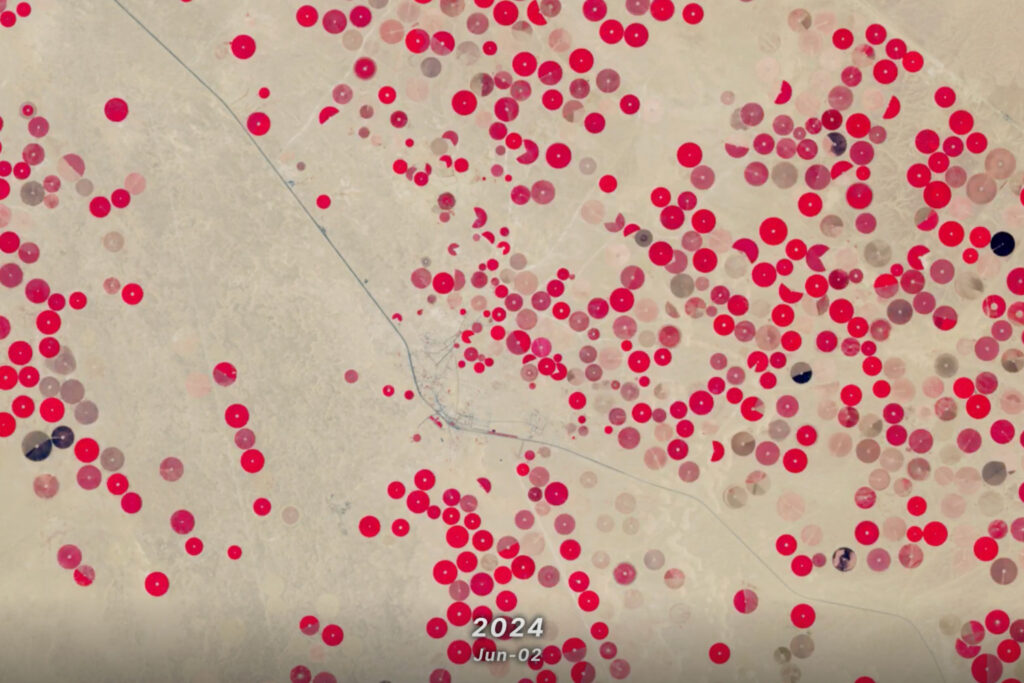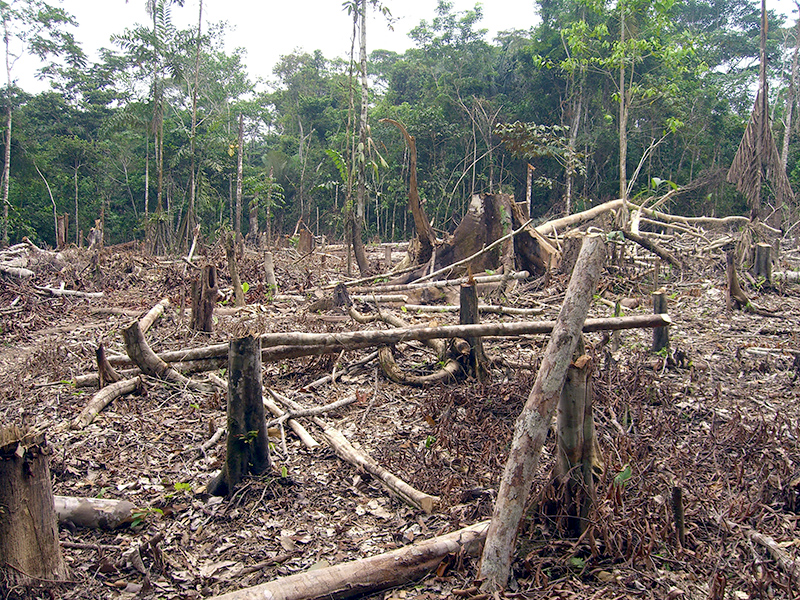
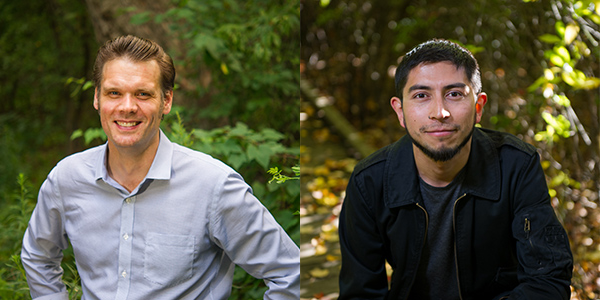
“The big issue is tracking deforestation in tropical countries,” says Pontus Olofsson, a research assistant professor in Boston University’s earth and environment department. Tropical rainforest in South America, Africa, and Southeast Asia has long been endangered: according to conservation organization Mongabay, the Brazilian Amazon lost over 5,800 km2 of rainforest in 2015. That’s down from over 18,000 km2 in 2000 but still larger than the area of Rhode Island. Olofsson and his colleagues study deforestation via remote sensing—using satellites or other tools to gather information about the Earth by scanning it from afar. Now, advances in remote sensing can help researchers and government officials monitor deforestation almost in real time.
Olofsson has studied land-cover change for years, but recently turned his efforts close to home. In a May 2016 survey of deforestation in New England, published in Environmental Research Letters, Olofsson gathered data from thousands of images of the Earth taken by the United States’ Landsat satellites. Begun in the 1970s, and inspired by photographs of Earth taken during early manned space missions, the Landsat program launched the first civilian satellite to take photos of Earth’s surface in order to study it. The images provide data from decades of observation and have enough resolution for scientists to distinguish areas of forest from low- and high-density urban areas and farmland with relative ease. “We can track each pixel in time and see what’s happening to the land,” says Olofsson.
In the New England study, Olofsson and his collaborators studied Landsat images from 1985 to 2011, a technique called a time series analysis, to see how forest has changed. Conventional wisdom held that New England had regrown much of its forest after the Industrial Revolution diverted people away from farming. But when the scientists analyzed images of Connecticut, Rhode Island, Massachusetts, New Hampshire, Vermont, and the lower, most populous, third of Maine, they saw that the region had been deforested over the past 30 years. Although the overall forest loss was only 3–4%, it was still unexpected. Much of the forest was replaced with residential homes and other urban development, like industry, golf courses, and landfills.
A decade ago, it would have been impossible for most researchers to discern so much detail. The United States Geological Survey only made the data from Landsat open-source and free to the public in 2008. Before that, researchers had to purchase images for hundreds to thousands of dollars each, making it economically unfeasible to look at more than a pair of snapshots and make a “before and after” comparison. Since the images have become free to download and analyze, the applications of remote sensing have exploded.
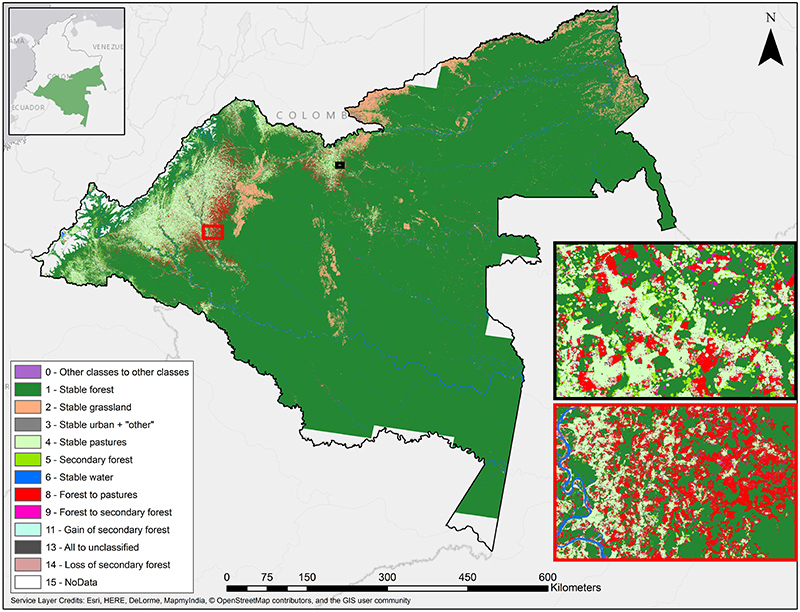
BU PhD student Paulo Arevalo works with Olofsson, focusing on forest change in his home country of Colombia using data from the mid-1990s through the present. “Before, it was like looking at a picture of when you were a kid and then looking at one when you were 25 years old and ignoring all the things that happened in between,” he says. Being able to monitor deforestation in greater detail with time series analysis has allowed him to see patterns of land change that had never been explored in depth before. For example, in the Colombian Amazon, he found that communities would clear a portion of forest for subsistence agriculture, then abandon it and move on. If left alone over years, the cleared patches can regain their forest cover. However, previously farmed patches of vegetation are likely to be occupied by other communities who might clear the land again. Both patterns can be seen in Colombia, but deforestation is more prevalent and damaging.
Colombia has historically lost hundreds of square kilometers of rainforest every year. From 1990 to 2010, the Colombian Institute of Hydrology, Meteorology and Environmental Studies estimates that over 3,000 km2 were lost, an area half the size of Delaware. Arevalo has downloaded about 5,000 Landsat images and is now monitoring where that deforestation is happening in the country using time series analysis.
Arevalo, Olofsson, and their colleagues, BU PhD students Christopher Holden and Eric Bullock, and Curtis Woodcock, also a BU professor of earth and environment, are working with the governments of Colombia and other nations to help them monitor rainforests and meet global expectations for reducing deforestation. One of their sponsors is SilvaCarbon, a US government program under the President’s Global Climate Change Initiative that monitors deforestation and carbon emissions and looks for the best methods to measure and model environmental changes around the world. SilvaCarbon and its collaborators, like the United Nations Collaborative Programme on Reducing Emissions from Deforestation and Forest Degradation in Developing Countries (UN-REDD), also educate countries on how to report and reduce carbon emissions.
Deforestation affects the Earth’s carbon cycle, and Arevalo plans to find out how. Trees absorb carbon dioxide from the air as they grow and release it again when they die and decompose. Halting or even slowing deforestation could have a huge impact on the carbon cycle and, scientists expect, on climate change.
“The amount of knowledge being produced just by looking at these data is massive,” says Arevalo. “It means we can learn things faster, we can improve the methods much more easily, and we can look into what other researchers are doing. Everybody wins with that.”
Related Reading:
+ Landsat Chronicles Deforestation in Colombia, USGS Image of the Week
+ Landsat Eyes Help Guard the World’s Forests, USGS
+ Staying Alert: How a New Landsat-Based Tool Spots Deforestation, NASA Landsat Science