Presentation Title
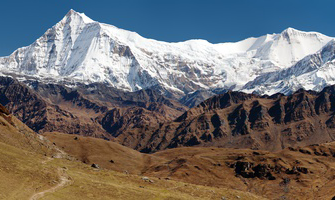
Monitoring the State of Glaciers in the Himalayas Using Satellite-based Multi-spectral Measurements
What are the major findings of this research?
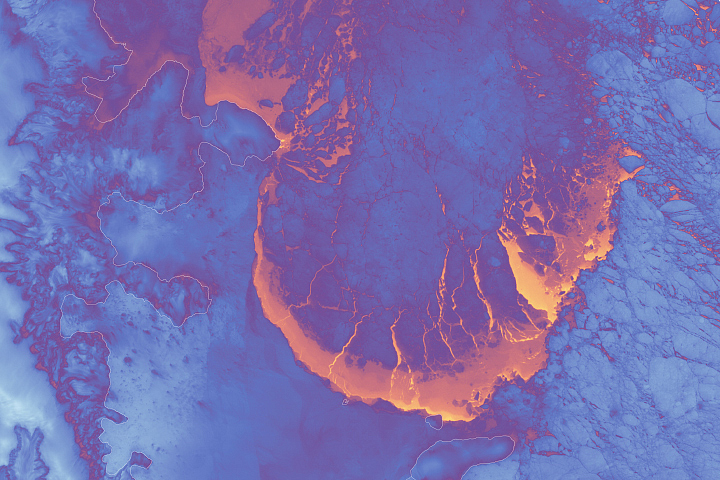
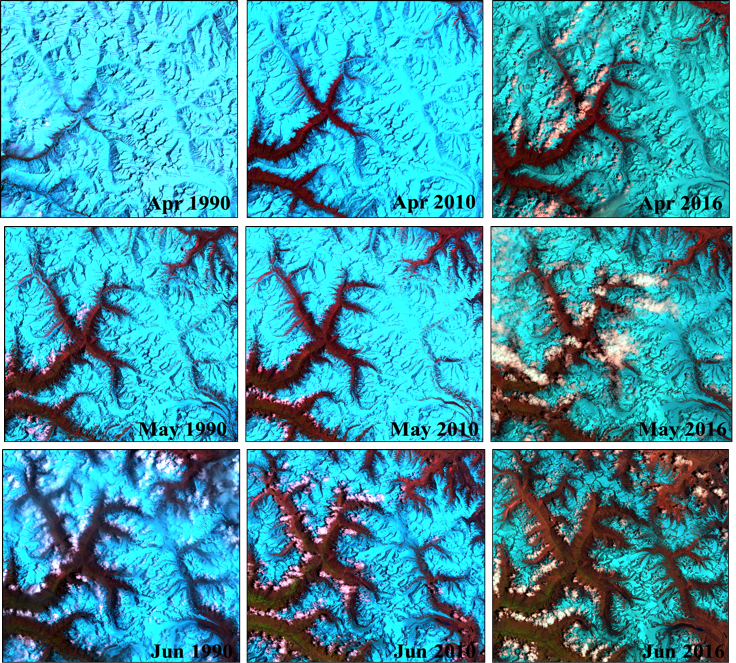
We have carried out analysis of Landsat data from different sites. Our findings show pronounced changes in Landsat visible and near infrared spectral reflectance over the western Himalayas associated with dust deposition in snow during the pre-monsoon period (April-July). We have analyzed Landsat images prior to and after the dust storms to study the changes in the spectral reflectance. MODIS images were used to track the dust reaching the Himalayan glaciers in our study region.
What are the implications of your findings?
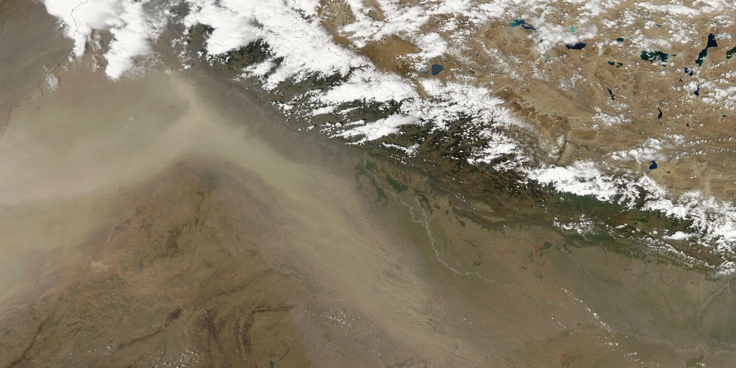
Dust storms coming from Arabia are common events. These dust storms reach the Himalayan region depending upon the meteorological conditions, wind direction, and wind velocity. Due to dust deposition over the glaciers, reflectance characteristics change drastically and the reflectance values sharply decrease. The pronounced reduction in reflectance and spectral reflectance characteristics clearly show impact of dust deposition on glaciers. The dust deposition on the glaciers will enhance melting and thus water discharge into the rivers will increase—which can cause flooding downstream.
What insight did you gain from Landsat that would have been impossible to glean otherwise?
Landsat provides wide coverage of the Himalayas for years with spatial and spectral quality, especially now, with Landsat 8 that has enhanced spectral resolution, which enables the monitoring of glacier state. In this way, we are able to quantify (and compare with field measurements) the spectral response from snow and the implications not only of dust but also of anthropogenic emissions in the Indo-Gangetic valley. Landsat data are now freely available, so one can get information about the state of glaciers and glaciers changes due to dust and anthropogenic emissions.
Why is it important to look at glacier melt on an intra-seasonal time scale?
The monitoring of glaciers on an intra-seasonal enables us to observe not only dust deposition observed during pre-monsoon season, but also the impact of growing atmospheric pollution in the Indo-Gangetic basin over more than three decades—especially during winter season. During winter season, it is sometimes difficult to get cloud free images, but when available, they are of great help understanding the spectral reflectance characteristics of glaciers. The spectral reflectance characteristics may provide textural characteristics of glaciers and have indirect information about the melting state after the winter season. So, the assessment of changes in spectral reflectance during different epochs can provide information related with snow surface influences and possible dynamics of ice accumulation and melting.
Co-author:
Samara Calçado de Azevedo
UNESP Sao Paulo State University
Anyone can freely download Landsat data from the USGS EarthExplorer or LandsatLook.
Further Reading:
+ Landsat Abounds at #AGU16