Excerpted from Elizabeth Goldbaum, NASA Earth Science Division
=•=
Editor’s note: NASA has recently funded eight projects that examine the connections between the COVID-19 pandemic and the environment. Three studies use NASA/USGS Landsat data, those studies are highlighted below.
=•=
While scientists around the world are confined to their homes during the COVID-19 pandemic, Earth observing satellites continue to orbit and send back images that reveal connections between the pandemic and the environment. “Satellites collect data all the time and don’t require us to go out anywhere,” Hannah Kerner, an assistant research professor at the University of Maryland in College Park, said.
Kerner is among eight researchers recently awarded a rapid-turnaround project grant , which supports investigators as they explore how COVID-19 lockdown measures are impacting the environment and how the environment can affect how the virus is spread.
The newest group of projects includes six that are looking to satellite images to help reveal how COVID-19 lockdown measures are impacting food security, fire ecology, urban surface heat, clouds and warming, air pollution and precipitation, and water quality and aquatic ecosystems. Two projects are exploring how the environment could be impacting how the virus is spread by monitoring dust and weather.
NASA’s Earth Science Division manages these projects that find new ways to use Earth observing data to better understand regional-to-global environmental, economic, and societal impacts of the COVID-19 pandemic.
Counting crops during COVID
This year was looking to be a relatively normal year for crops until the pandemic and associated lockdown policies happened. Reduced air and ground travel caused the demand for ethanol to plummet, which caused corn prices to decline. Lockdown policies also made it harder for officials from the U.S. Department of Agriculture (USDA) to travel to farms and collect information about crop planting, progress, and conditions.
The subsequent lack of public information about crops caused uncertainty and volatility in agricultural markets and prices as growing seasons progressed. “Markets want to know how much of a specific kind of crop to expect,” Kerner said.
Kerner and her team are looking to satellite data from NASA’s and the U.S. Geological Survey’s Landsat, ESA’s (the European Space Agency) Copernicus Sentinel-2, NASA’s Moderate Resolution Imaging Spectroradiometer (MODIS) aboard the Terra and Aqua satellites, and Planet’s satellites to help supplement USDA’s information.
“We’re using satellite data and machine learning to map where and which crops are growing,” Kerner said. Specifically, they’re monitoring key commodity crops, which are corn and soybeans in the U.S. and winter wheat in Russia.
Fewer cars might mean hotter surfaces
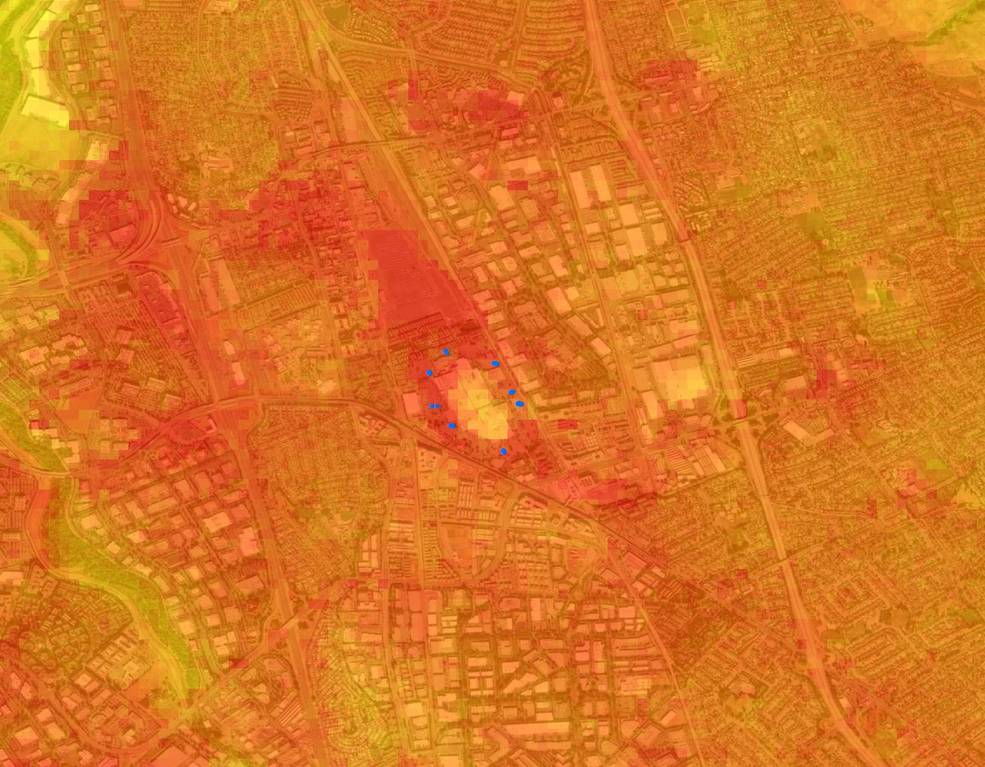
Christopher Potter, a research scientist at NASA’s Ames Research Center in California’s Silicon Valley, is looking at how California’s shelter-in-place mandate in the San Francisco Bay Area has reduced the number of cars on the road and changed how parking lots, highways, and large industrial buildings’ surfaces absorb sunlight and reflect infrared heat.
“It suddenly got so quiet,” Potter said, “There was no traffic anywhere in late March and April.”
Potter and his team are monitoring parking lots and other surfaces to see if they are hotter or cooler during the pandemic. Visible light from the sun hits the surface and then is absorbed and reradiated as heat – a process called thermal heat flux.
The team is using satellite thermal infrared sensor brightness temperatures from Landsat and land surface temperature from ECOSTRESS, which is a NASA sensor on the International Space Station, to map out large, flat urban features in the Bay Area and measure their thermal heat flux. He’s also gathering on-the-ground measurements to ground truth the data.
Potter is asking questions like, if automobiles are parked and concentrated in giant lots, do you change the reflectance of the surface and the overall heat flux? Even shiny car windows may be enough to reflect sunlight, Potter said.
Potter and his team want to know how the entire Bay Area’s urban heat flux has changed during the pandemic, and how that change has contributed to a more or less healthy environment for the millions of people living in it. Understanding potential changes in the thermal heat flux is a key indicator of how COVID-19 has altered the Bay Area’s environmental footprint, Potter said.
Finding a human imprint on water quality in Belize
The coastal area of Belize includes the largest barrier reef in the Northern Hemisphere, offshore atolls, several hundred sand cays, mangrove forests, coastal lagoons, and estuaries.
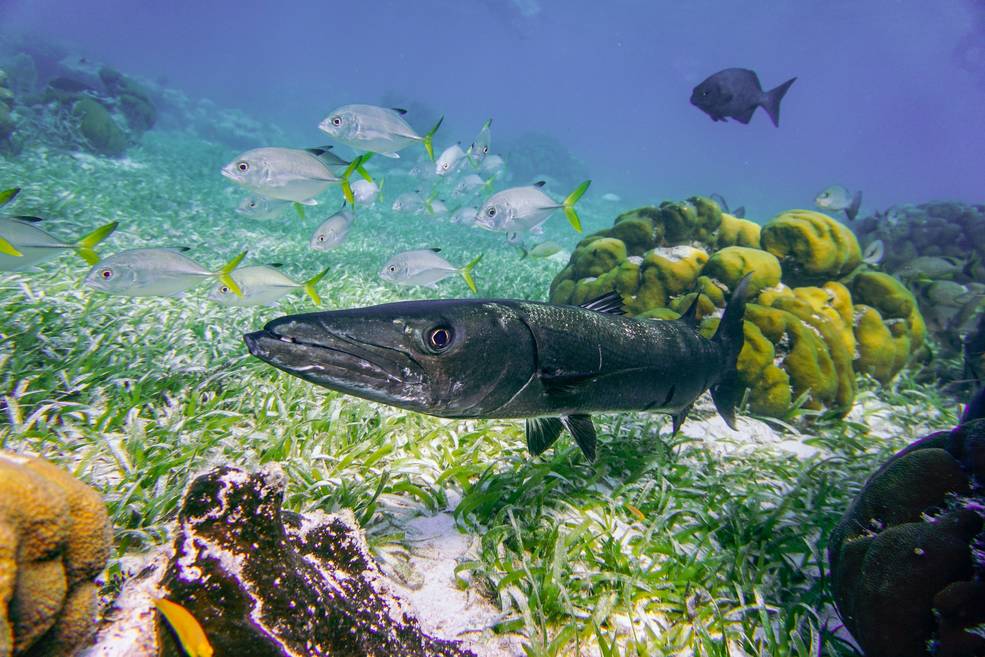
It is one of the most biodiverse ecosystems in the Atlantic and is home to colorful fish and playful sea turtles, many of which are endangered.
Robert Griffin, a professor at the University of Alabama in Huntsville, was working on a NASA project to study the reef’s health when COVID-19 happened. “The pandemic created a natural experiment,” Griffin said, to better understand how urban pollutants affect water quality and coral reef health.
Griffin and his team are studying how decreased tourism is impacting urban and agricultural sources of pollutants, such as nitrogen and phosphorus,
to water quality off the coast of Belize.
In addition to on-the-ground data, the team is using Landsat images to note how the pandemic is affecting land use changes, which affects how many pollutants are produced and able to reach water bodies and ecosystems. Griffin is also using MODIS and VIIRS data to monitor water quality.
Griffin’s team is working with Belize government officials to help guide coastal marine development for the upcoming five years. “This research could provide guidance for land use planners as they determine how to deal with urban non-point sources of pollution,” like nutrients and sediments, that end up in the water and impact coral reef systems, Griffin said.