
Sep 9, 2020 • Sixty-five percent of Canada is covered by forests, this massive area—encompassing large expanses of trees, as well as wetlands and lakes—is not only an important carbon repository and biodiverse habitat, its timber also supports a sizeable slice of Canada’s economy, providing hundreds of thousands of jobs and contributing over $19 billion to the economy in 2018 (CAN $25.8B).
Since 2008, when the USGS Landsat archive was opened and its data made available for free, forest scientists have relied on Landsat to chart the impact of timber harvesting, wildfires, pests, disease, and development on Canada’s forested ecosystems. Landsat has become fundamental for understanding where and how often forest disturbances are happening and for tabulating how much forest area is affected each year—but disturbed area is only part of the story.
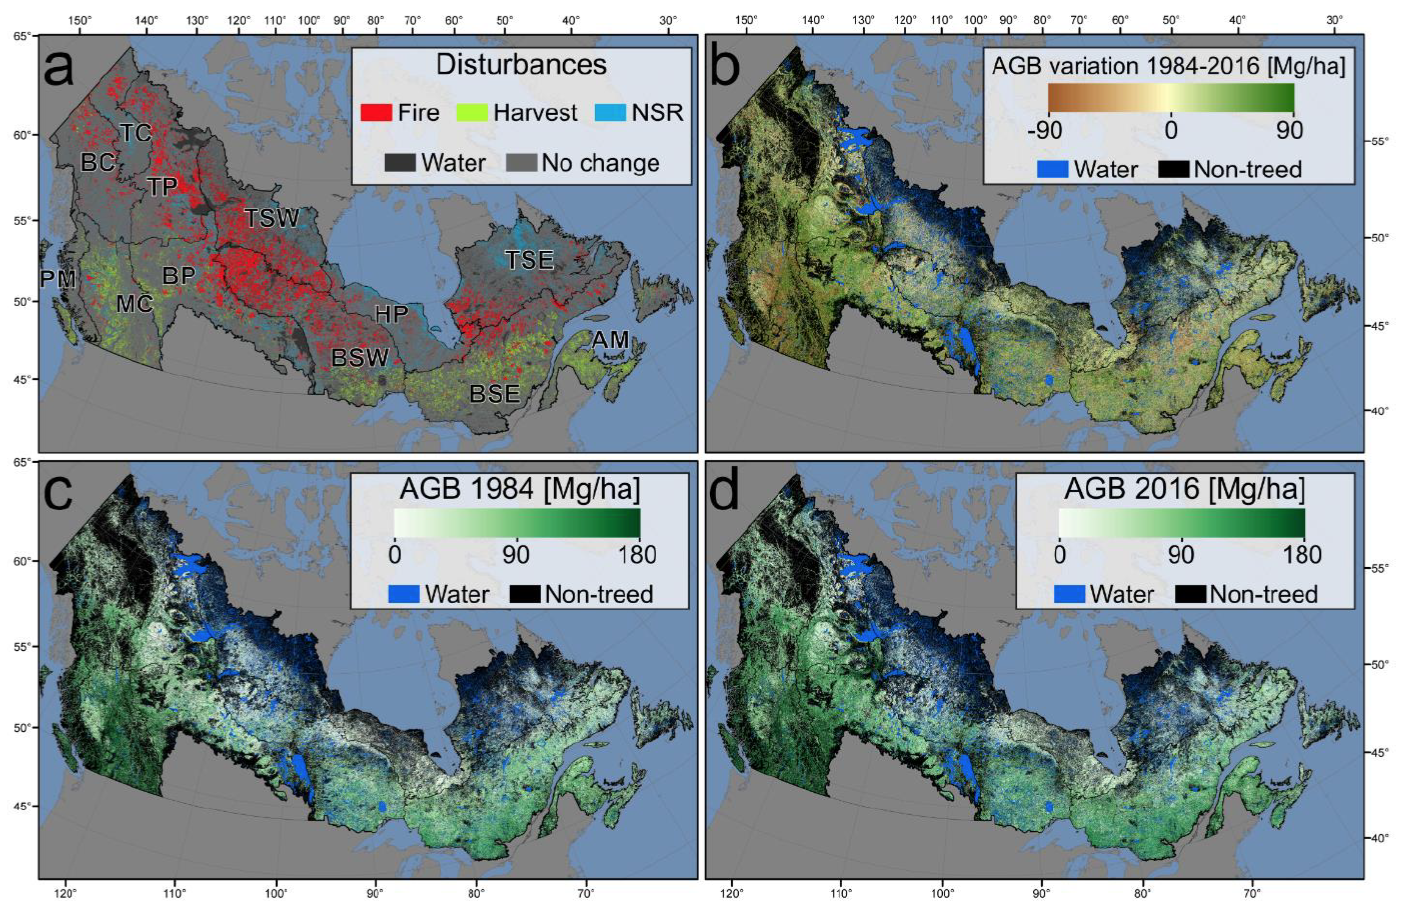
Now, as recently reported in Environmental Research Letters, using hundreds of thousands of Landsat images, the Canadian Forest Service (CFS) and partners have developed an approach to measure nationwide aboveground treed biomass from year-to-year across the last three decades. Biomass accounts for the mass of organic material that makes up a tree. Aboveground biomass is an important metric for estimating carbon, with implications for long term carbon balancing and climate change mitigation strategies.
“Larger biomass reductions related to harvest and wildfire are captured, as is common,” explains Dr. Mike Wulder, a senior research scientist with CFS, and lead author of the study. “But we also account for the small accruals of biomass that occur as trees grow over large, undisturbed forest areas and these add up to notable amounts.”
Wulder’s team reports a net increase of 5.38 petagrams of forest biomass between 1984 and 2016; carbon-wise, that is equivalent to a train of loaded coal cars long enough to wrap itself around Earth nearly 34 times.
The amount of aboveground treed biomass added in areas of undisturbed forests, as trees grew over the study period, was a substantial 3.90 petagrams.
Yet, forests disturbed by harvesting, fire, pests, disease, and development lost an almost equal amount of biomass (3.94 petagrams), despite occupying only a quarter as much area as undisturbed forests.
With undisturbed and disturbed areas nearly canceling out each other’s biomass changes, forest regrowth and areas newly-treed since 1984 made a significant contribution to the overall biomass balance.
Over 235,000 square miles of Canada’s forested ecosystems became treed over the three decades considered in the study (61.05 Mha, an area equivalent in size to Arizona and New Mexico combined), and accounted for a biomass increase of 5.41 petagrams.
This cumulative number has important carbon implications, but just as important for forest managers are the new insights Landsat has yielded about forest biomass dynamics—the patterns of year-to-year biomass changes as forests age, burn, are harvested and regrow.
Asymmetries between disturbed area and disturbed biomass
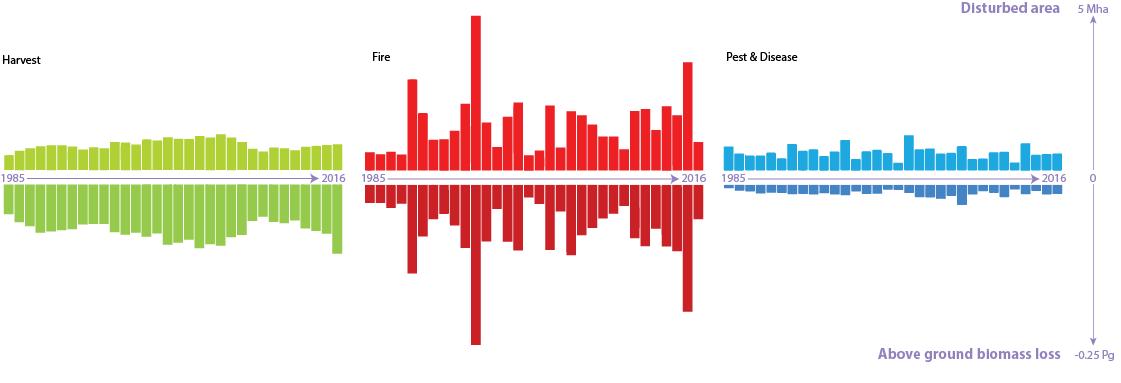
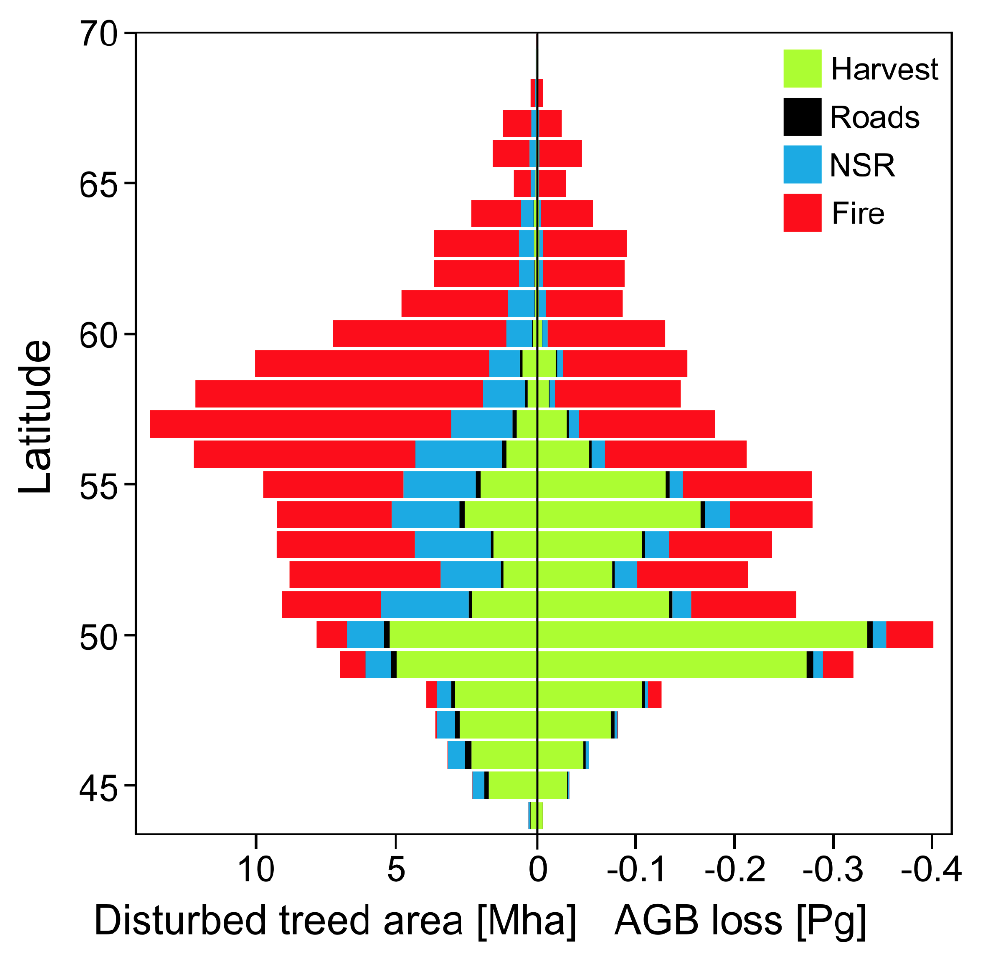
Fire, by far, disturbs the largest area of forest, consuming over 6,200 square miles (1.61 Mha) of forest each year on average. Over the three decades of this study, the years with the greatest biomass losses were the years with staggeringly large wildfires.
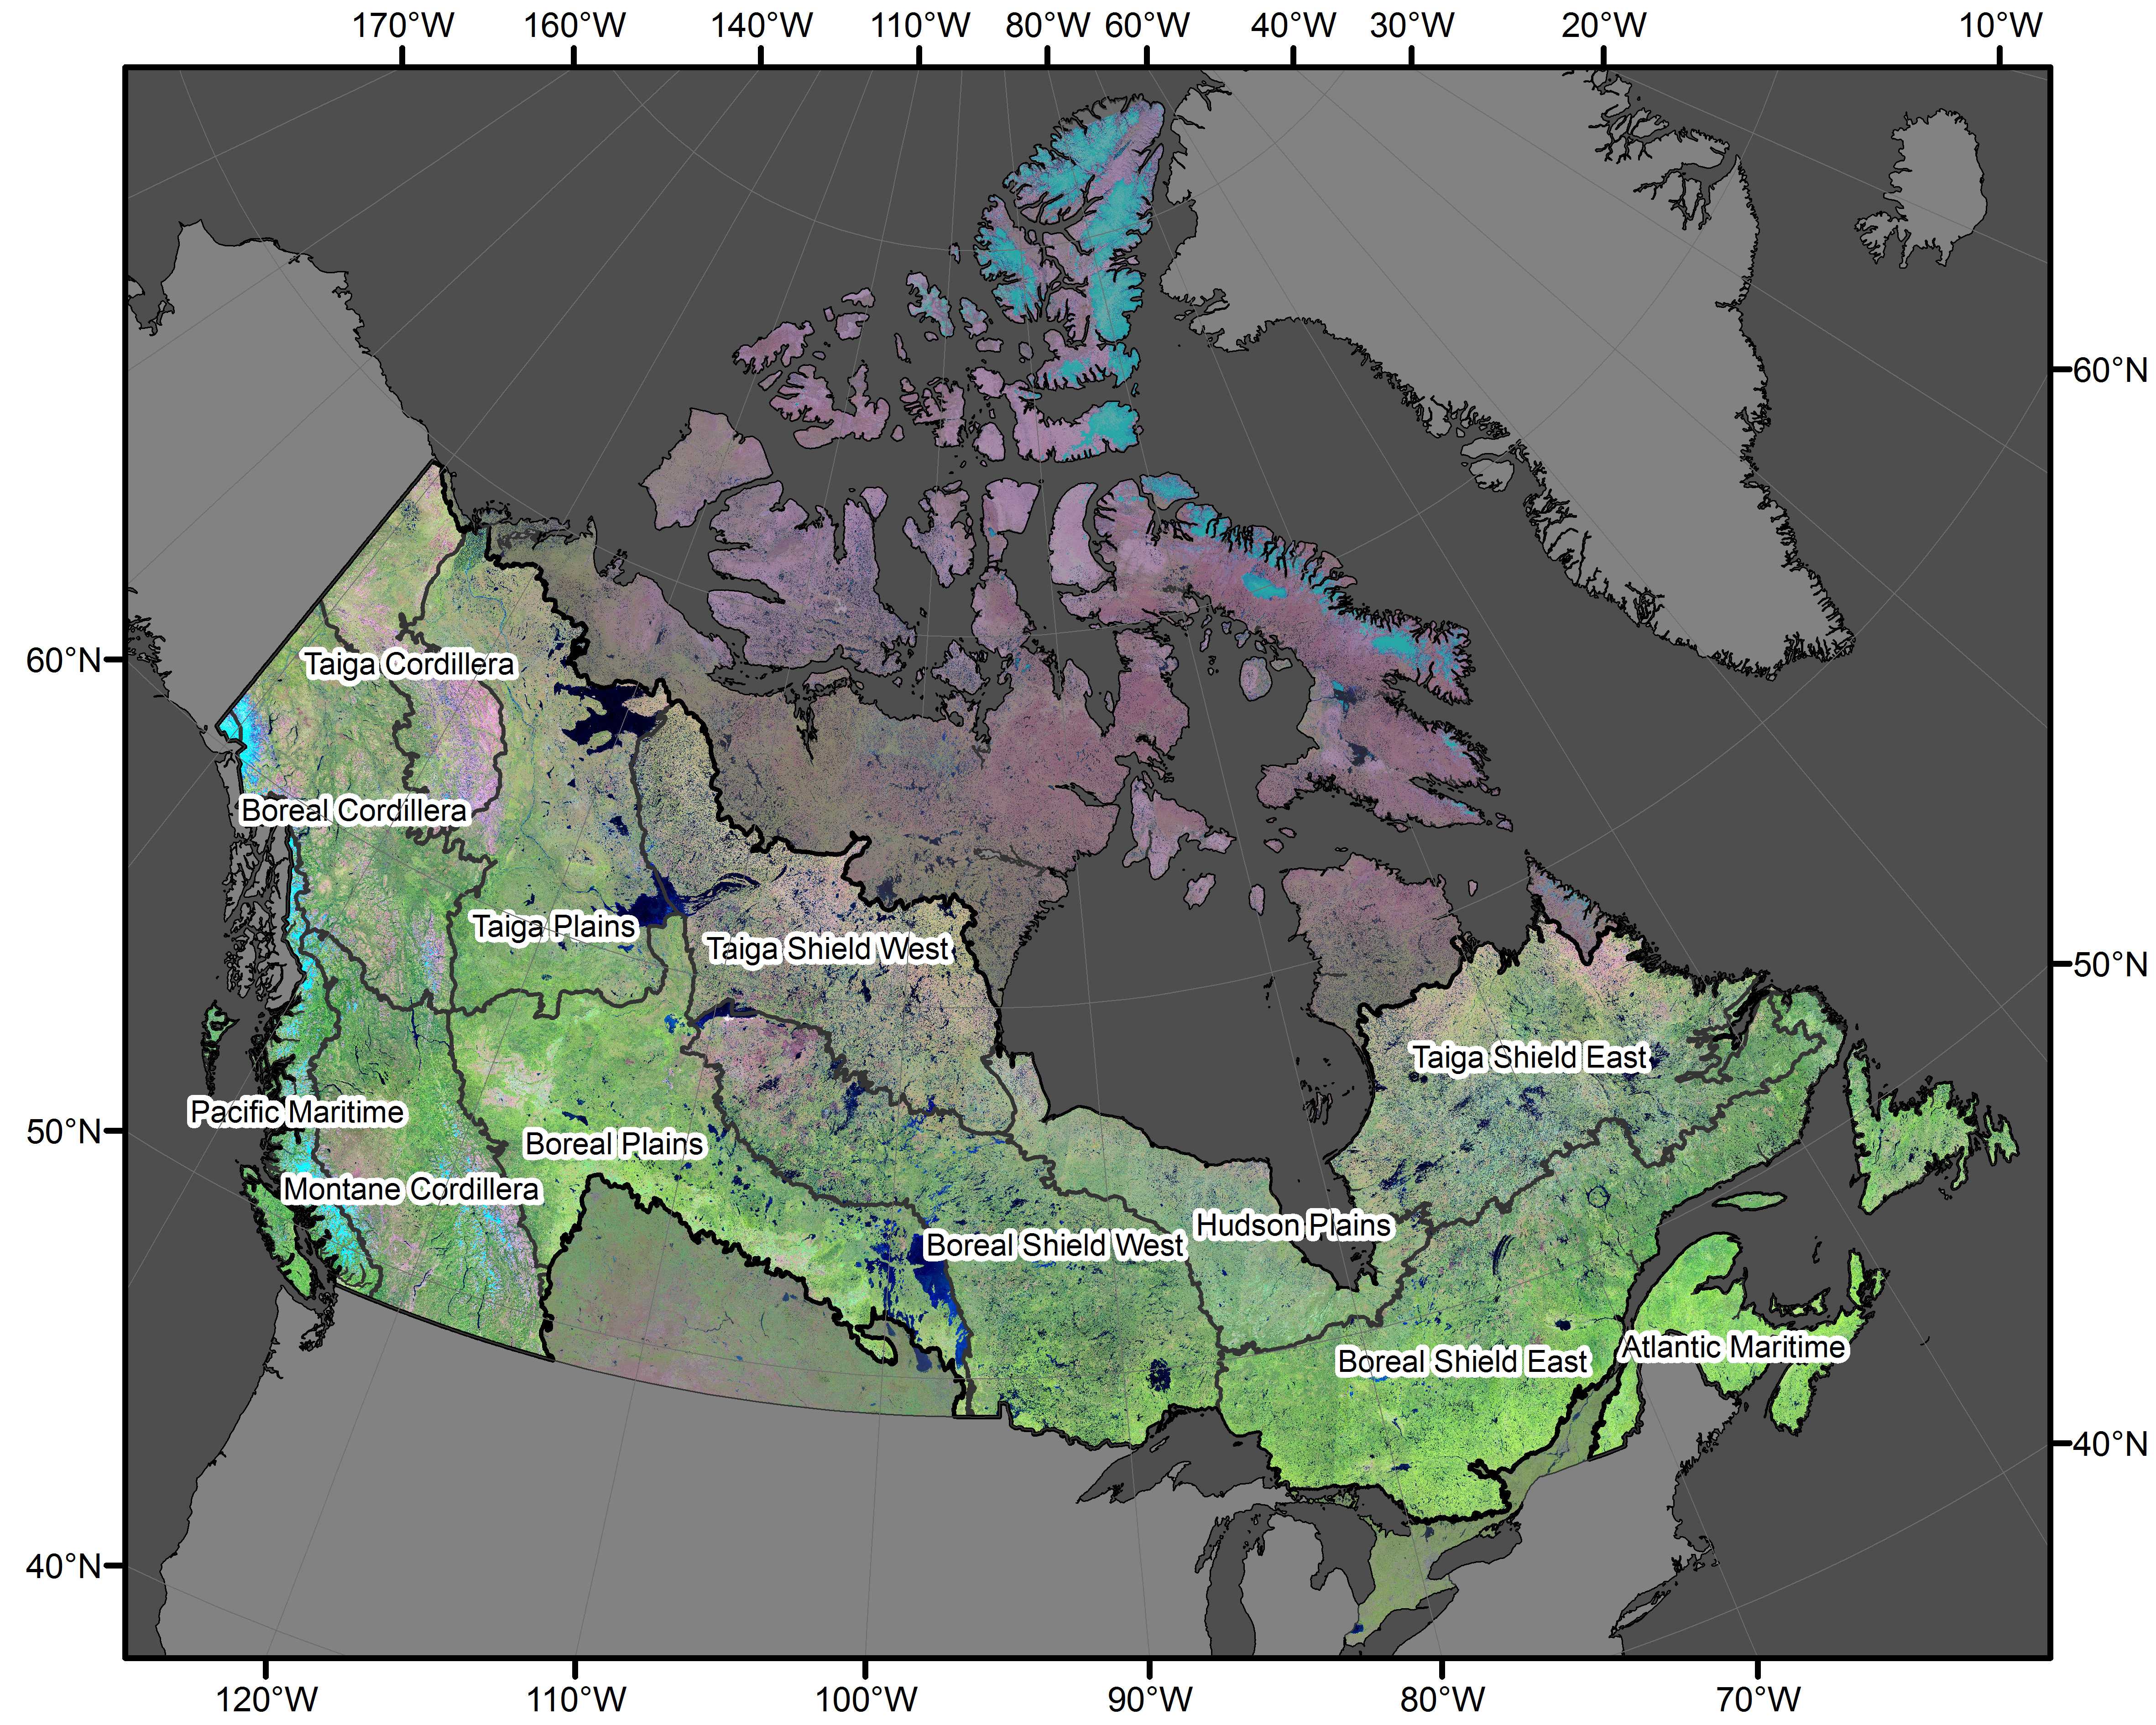
Canada’s forested lands are divided into 12 ecozones, each with their own forest characteristics. While northern forests in Canada are largely unmanaged, in the south, managers oversee harvest agreements and fire suppression activities.
Forests’ ability to build up biomass in Canada varies markedly by latitude. Northern boreal regions with their long winters and nutrient-poor soils, amass biomass more slowly. At the same time, a sparse population and limited road access seriously limit fire suppression efforts there. Whereas fire suppression is a priority in the highly productive, managed, southern forests.
Rates of biomass loss due to fire vary greatly from year to year depending on the severity of the wildfire season, and this is especially so for northern forests.
Harvesting rates, meanwhile, stay relatively steady. While the harvesting rates are stable (or declining) where the trees are harvested makes a big difference from a biomass standpoint.
The large, dense trees that are harvested in the Pacific Maritime and Montane Cordillera zones (like those of the U.S. Pacific Northwest) have more biomass than trees found elsewhere in Canada. This makes the rate of aboveground treed biomass loss greater on a per unit area basis in these harvested areas.
By using a single, consistent data source, Wulder and his team were able to tease out the relationship between the area of forest disturbed and the biomass implications of those disturbances.
Landsat-based methods to record where and when forests are disturbed have formed the basis for operational mapping activities and reporting for some time. More recently, scientists have started using Landsat data to figure out why the change happened—Fire? Harvesting? Disease? Once the where, when, and why of forest change is known, the what (implications of that change)—like above ground biomass consequences—can be established. Forest change wrought by fire and harvesting causes large and immediate biomass losses, while biomass gains made by undisturbed forests are slow, but steady and add up to significant amounts over time.
This research—focused on the implications of forest change—found that wildfires consume the largest area of forest, but the aboveground biomass consequences are about the same as harvesting. Harvesting occurs over ~2,500 square miles (0.66 Mha) of forest in Canada each year, whereas about 4,700 square miles (1.22 Mha) of the treed area is impacted by wildfire annually.
Due to replanting rules and generally higher productivity, harvested forests recover much faster and replenish biomass stores more quickly.
Looking at forest metrics by latitude also revealed trends: there is more area disturbed by fire in northern locations and more harvesting happens in the south. But despite disturbing more forest, burned northern regions have less biomass change than managed southern regions (a consequence of latitudinal growth rates).
Modeling makes these measurements possible
Biomass cannot be directly measured with reflectance measurements made by optical sensors like those onboard the Landsat satellites, so the authoring team took some important and innovative steps to derive the annual aboveground treed biomass estimates used in their study.
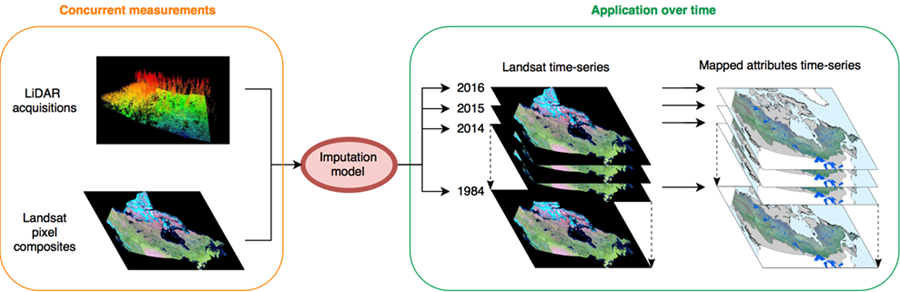
Ground-based measurements are commonly used to train models that incorporate satellite data to correctly classify forest structure, but ground plots are limited and require lots of boots on the ground. Fortunately, lidar data have become more widely available and can collect detailed forest structure information over large areas. For this work, coast-to-coast lidar transect data were used as an intermediary: ground data informed the lidar forest structure estimates (biomass, volume, stand height), then those lidar estimates were used to link the surface reflectance data collected by Landsat to the forest structure measurements—a method that requires highly accurate spectral surface reflectance measurements to work.
Landsat, with its long archive and rigorously calibrated surface reflectance, was used to create Canada-wide mid-summer image composites for every year from 1984–2016 with a best-available-pixel approach. All forested Landsat pixels were then assigned the appropriate modeled structure information, allowing each pixel to tell the story of forest structure change from year-to year. To calculate biomass changes, the resulting forest structure composites were combined with Landsat-derived forest disturbance history (where forests were disturbed each year; what caused the disturbance).
“We use a time series of Landsat derived maps to offer insights on the biomass dynamics for Canada’s forested ecosystems,” Wulder said. “Using Landsat time series data, we can incorporate the impact of disturbance by type and thanks to Landsat’s calibrated radiometry, we can also determine the uptake of biomass over areas that have not changed.”
The resulting data set provides insights regarding biomass dynamics across Canada. Importantly, the data set provides spatially-explicit mapped information about biomass and related dynamics that can complement Canadian land managers’ ongoing official monitoring and reporting activities.
The data will also be used for future science work with goals to inform policy development. And, given the global extent of Landsat, the methods used to create the data set can be extended to, and replicated in, to locations outside of Canada.
Reference:
Wulder, M.A. Hermosilla, T., White, J.C., Coops, N.C. (2020). Biomass status and dynamics over Canada’s forests: Disentangling disturbed area from associated aboveground biomass consequences. Environmental Research Letters. 15, 094093. DOI: https://dx.doi.org/10.1088/1748-9326/ab8b11 [open access]
Science brief written by Laura E.P. Rocchio


