
Global change and human actions are driving rapid changes to tidal wetlands – tidal marshes, mangroves and tidal flats – worldwide. However, ecosystem restoration and natural processes are playing a part in reducing total losses.
But efforts to estimate their current and future status at the global scale remain highly unclear due to uncertainty about how tidal wetlands respond to drivers of change.
In a new study, researchers have developed a machine-learning analysis of vast archives of historical satellite images to detect the extent, timing and type of change across the world’s tidal wetlands between 1999 and 2019.
They found that globally, 13,700 square kilometres of tidal wetlands were lost, offset by gains of 9,700 square kilometres, leading to a net loss of 4,000 square kilometres over the two-decade period.
The study is published in the journal Science.
“We found 27 percent of losses and gains were associated with direct human activities, such as conversion to agriculture and restoration of lost wetlands,” said Dr Nicholas Murray, Senior Lecturer and head of James Cook University’s Global Ecology Lab, who led the study.
All other changes were attributed to indirect drivers such as human impacts to river catchments, extensive development in the coastal zone, coastal subsidence, natural coastal processes and climate change.
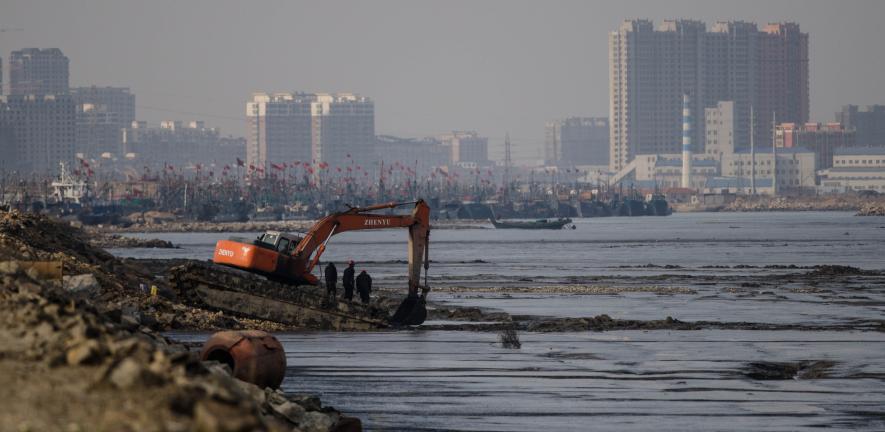
About three-quarters of the net global tidal wetland decrease happened in Asia, with almost 70 per cent of that total concentrated in Indonesia, China and Myanmar.
“Asia is the global center of tidal wetland loss from direct human activities. These activities had a lesser role in the losses of tidal wetlands in Europe, Africa, the Americas and Oceania, where coastal wetland dynamics were driven by indirect factors such as wetland migration, coastal modifications and catchment change,” said Murray.
The scientists found that almost three-quarters of tidal wetland loss globally has been offset by the establishment of new tidal wetlands in areas where they formerly did not occur – with notable expansion in the Ganges and Amazon deltas.
Most new areas of tidal wetlands were the result of indirect drivers, highlighting the prominent role that broad-scale coastal processes have in maintaining tidal wetland extent and facilitating natural regeneration.
“This result indicates that we need to allow for the movement and migration of coastal wetlands to account for rapid global change,” said Murray.
He added: “Global-scale monitoring is now essential if we are going to manage changes in coastal environments effectively.”
Over one billion people now live in low-elevation coastal areas globally.
Tidal wetlands are of immense importance to humanity, providing benefits such as carbon storage and sequestration, coastal protection, and fisheries enhancement.
“Protecting our coastal wetlands is critical to supporting coastal communities and the wider health of the planet. These areas are the last refuge for many plants and animals,” said Dr Thomas Worthington, Senior Research Associate in the University of Cambridge’s Department of Zoology and co-author of the study.
He added: “This data can help identify coastal areas most impacted – and therefore in need of protection, or areas where we can prioritise restoration.”


