by Ginger Butcher, Chris Barnes, Linda Owens for GIM International
The Landsat satellites provide an uninterrupted space-based data record of the Earth’s land surface to help advance scientific research towards understanding our changing planet. In this article, the authors look at how the use of data from Landsat satellites has evolved over time to become a cornerstone of global land imaging with broad societal benefits. They conclude that the Landsat archive is poised to shift into a more real-time monitoring capability to help further our understanding of a changing Earth.
Since 1972, the Landsat satellites have provided an uninterrupted space-based data record of the Earth’s land surface to help advance scientific research towards understanding our changing planet. Early Landsat satellites generated a wealth of new data that improved mapping of remote areas and geological features along with digital analysis of vegetation. Landsat’s spatial and spectral resolutions have advanced its use for broader societal benefits such as global crop forecasting, forest monitoring, water use, carbon assessments and as the basis for Google Maps. Landsat’s long-term data record provides an unrivalled resource for observing land cover and land-use change over a time scale of decades. The free and open Landsat data policy announced in 2008 unleashed global-level research without the onus of data cost. Evolving analytical and computing capabilities make it possible to tackle complex world problems in search of a solution.
A revolutionary new view of our planet
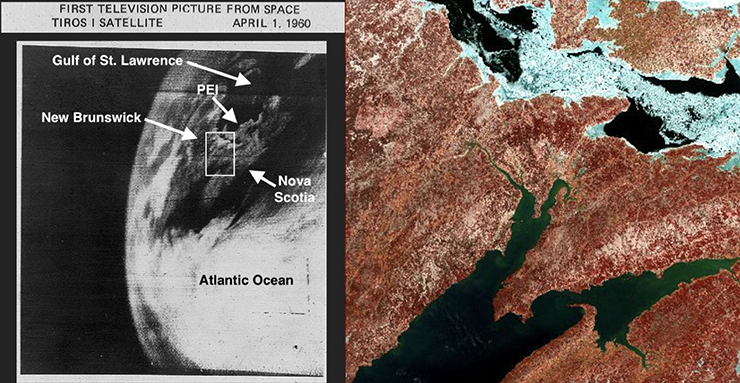
In the early 1970s, the environmental movement ushered in a new awareness about our planet. The convergence of this movement and the Landsat program was propitious. The Earth Resources Technology Satellite (ERTS), later named Landsat 1, was a proof-of-concept experiment to demonstrate that space-based remote sensing data could improve the management of our environment and natural resources. The USA would use the practical experience and evidence gathered from these early instruments to decide whether to pursue an operational land remote sensing program.
Re-charting the planet
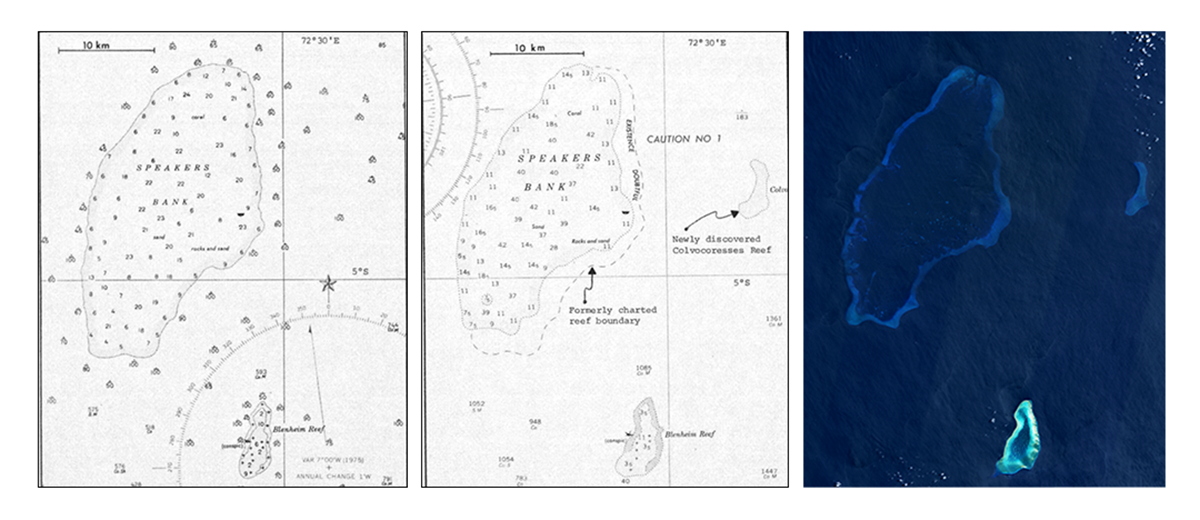
More than half of the Earth had yet to be accurately mapped at the time of Landsat 1’s launch in 1972. From the first downloads of data, many revelations appeared in the synoptic view of Landsat. Among these revelations, 1,200 miles of Antarctic coastline were redrawn, navigation charts were improved, a baseline map of the world’s glaciers was created and the positions and courses of many Amazon tributaries were amended. The repeat coverage of remote regions also helped to map sea ice to aid shipping navigation routes around the Arctic. Landsat’s medium resolution and large field-of-view made it easier for scientists to discern geological lineaments and identify fault lines in remote locations, the latter of which made contributions to the then-nascent theory of plate tectonics.
Realizing societal benefits
Practical applications held the most promise for social and financial benefits from Landsat data. Satellite data is a relatively low-cost alternative to aerial surveys, offering the potential to survey large areas for applications such as crop reporting, range management, forest management and soil surveying. Within Landsat’s first year, catastrophic flooding occurred along the Mississippi and Missouri rivers. Landsat data was used to map the extent of areas inundated by floodwaters. When the same areas flooded again in 1975, the U.S. Geological Survey (USGS) Earth Resources Observation and Science (EROS) Centre used the rapidly relayed satellite data from NASA to create a flood damage map to help support the case for disaster relief funds.
Landsat’s synoptic view also proved its worth as a resource for monitoring global crop production. In the early 1970s, the United States accounted for about 50% of worldwide grain exports and had large stockpiles of wheat. In July 1972, initially unaware of a growing global shortage in wheat harvests, the USA sold 15 million tons of wheat at a subsidized low price to Soviet traders. Shortly after, the US grain supply plummeted and grain prices soon reached 125-year highs in Chicago. Over the next year, food prices around the world rose by 50%. The Department of Agriculture’s Foreign Agricultural Service was instructed to establish a global crop surveillance and reporting system to prevent such major commodity losses in the future. Landsat data quickly became an essential part of this solution and a new emphasis was placed on the use of satellite observations for agricultural objectives and resource monitoring. To effectively forecast crops on a global scale, however, advances in automated processing and quantitative image processing were required.
Evolving from analog to digital
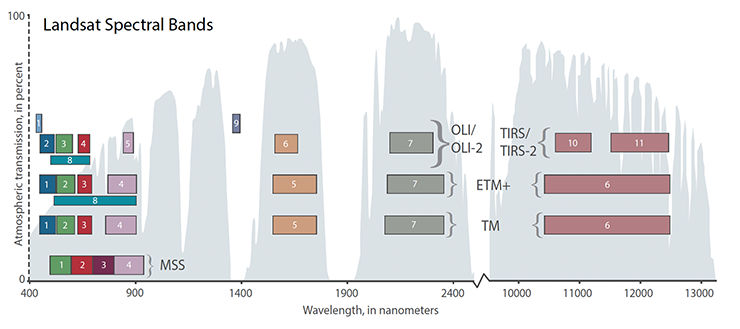
Early Landsat satellites (1-3) carried a Return Beam Vidicon (RBV) instrument based on proven television-based technology and a newly developed multispectral scanner system (MSS). The MSS was the first space-based instrument to digitally encode Earth data, to obtain calibration data in orbit and to measure data in multiple spectral channels with sufficient geometric fidelity to allow meaningful comparisons between those channels. While images can be processed from the MSS’s digital data to conduct qualitative analysis like aerial photos, the potential to analyze satellite data quantitatively – i.e. quantitative remote sensing – was revolutionary. The MSS quickly proved itself in applications such as classification of vegetation types and boosted the adoption of digital satellite data for Earth observation, leading to the development of more advanced multispectral instruments. This process of digital image processing and statistical analysis of data would redefine modern passive remote sensing from space.
Technical characteristics for the next generation of multispectral scanner instruments were defined based on applications – specifically agriculture and geologic exploration for the new Thematic Mapper (TM) requirements. The TM instrument would be much more sophisticated, with 30m resolution, seven spectral bands including a thermal infrared band, and continuation of onboard calibration. Optimally, the next mission would include two satellites for an eight-day repeat coverage. Landsats 4 and 5 launched in 1982 and 1984, respectively.
With each new generation of sensors, the needs of the Landsat user community continued to drive requirements for improved spatial and radiometric resolution, spectral and temporal coverage, geolocation and calibration. Landsat 7 launched in 1999 with the Enhanced Thematic Plus (ETM+) that added a panchromatic band for increased spatial resolution and increased thermal band resolution from 120m to 60m. In 2013, Landsat 8 was launched capturing around 750 scenes a day, an increase from the around 450 scenes a day by Landsat 7. The Operational Land Imager (OLI) and Thermal Infrared Sensor (TIRS) instruments on Landsat 8 have improved signal-to-noise ratio and radiometric performance enabling 12-bit quantization of data, thus allowing for more bits for better Earth surface land characterization. While all Landsat satellites have collected calibration data onboard, Landsat 8 added a lunar calibrator to conduct onboard calibration using the moon like a photographer’s ‘grey card’. The evolution of Landsat sensors has consistently improved data quality while maintaining precise calibration and backward compatibility within the archive. The data in the U.S. Geological Survey archive from 1972 to the present can be confidently inter-compared, both spatially and radiometrically, thus the archive has confirmed Landsat as the cornerstone of global land imaging.
Growth of Earth science research from space
Studies and applications of Landsat data continued to expand as this meticulously calibrated archive continued to grow. In June 1988, New England’s sugar maple forests were devastated by pear thrip damage. By the time authorities figured out what was happening, the trees were putting out their second round of leaves. Access to archived Landsat data was the only way scientists were able to accurately map the extent of the defoliation. In the late 1980s, scientists set out to assess global deforestation rates in the tropics using approximately 2,700 Landsat scenes from the archive and a geographic information system (GIS) to classify pixels into various land cover types and analyze spatial structures. Their results calculated the first credible and verifiable Amazon deforestation rates – a near-impossible task with previous labor-intensive and error-prone field sampling campaigns. These are just two of the many studies that emphasize the importance of a robust worldwide Landsat data archive.
In an effort to privatize and recoup the costs of this national investment, the US government passed the Land Remote-Sensing Commercialization Act of 1984. This resulted in exponential cost increases for Landsat data, with digital TM scenes costing up to US$4,400 each. At a time when computing power was increasing and the new field of GIS was budding, orders for Landsat imagery were decreasing – primarily due to the higher costs. These costs put Landsat data largely out of the hands of scientists working on large-scale or long-term studies, prompting some scientists to migrate to other coarser resolution datasets, like NOAA’s Advanced Very High Resolution Radiometer (AVHRR).
Free and open data policy unleashes full potential
In 2008, the USGS officially announced no-charge electronic access to any Landsat scene held in the USGS-managed national archive. This was a pivotal decision that removed financial barriers for institutions and researchers and opened up new and previously unimaginable Landsat applications. Prior to the free and open data policy, research was restricted to the data that institutions and researchers could afford, rather than the data they really needed to solve a problem. Since 2008, there has been a significant increase in the use of Landsat, especially in global multi-temporal applications such as the World Resources Institute Global Forest Watch web application that monitors global forests in near real time. Geoscience Australia Water Observations from Space uses Landsat data to better understand where water is usually present, for instance. The archive is also used by the Global Food Security-support Analysis Data Croplands database to provide the highest spatial resolution (30m) global cropland map to date. As of 31 October 2018, users had downloaded almost 90 million Landsat scenes from the USGS archive.
Landsat Global Archive Consolidation initiative
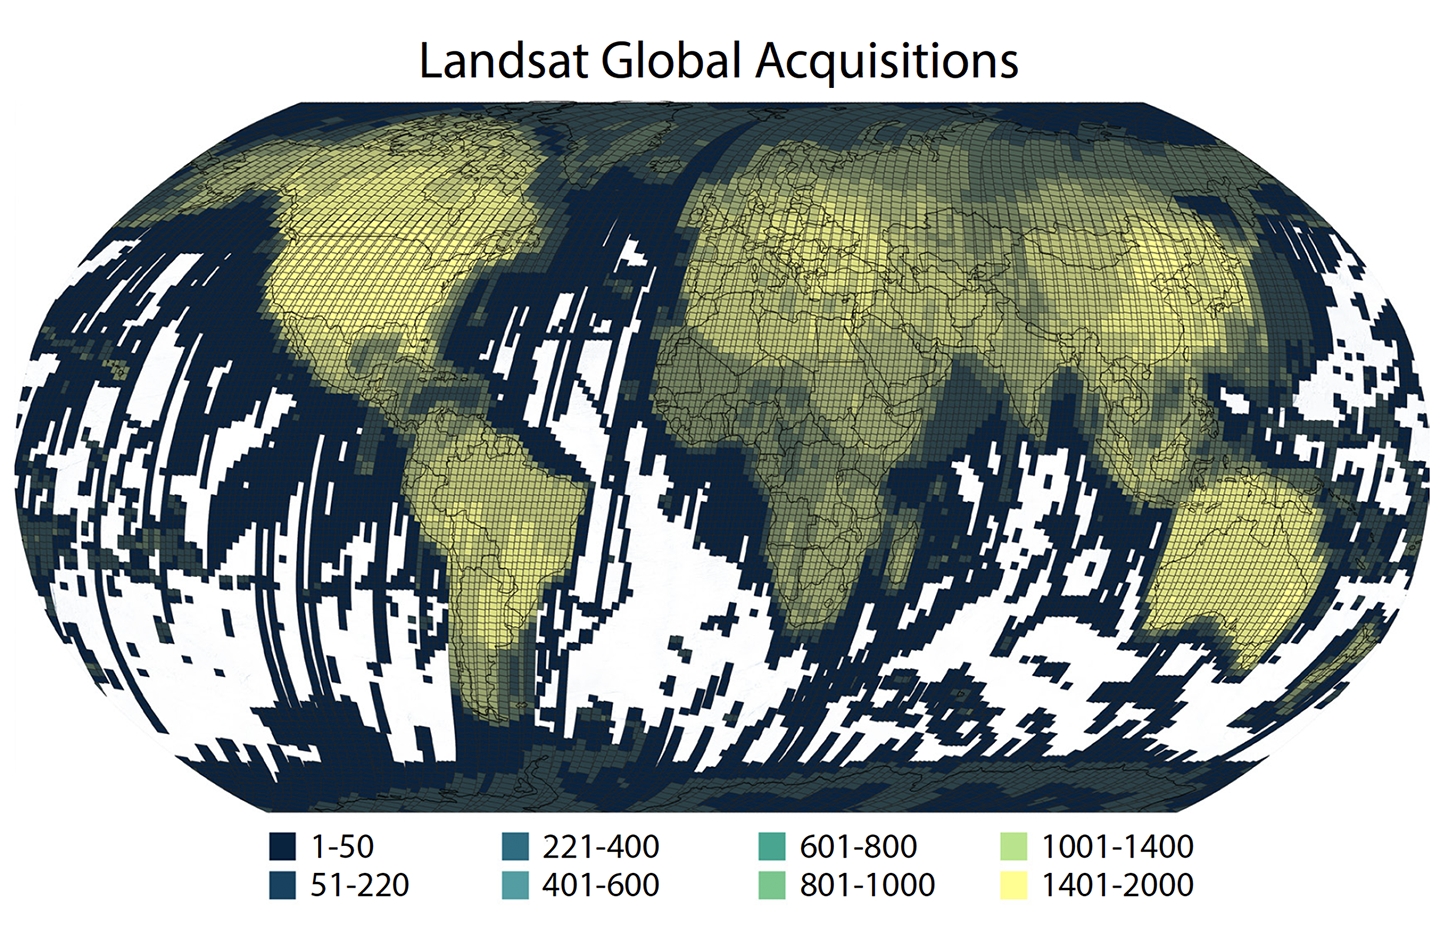
With the constrained onboard storage capabilities of older Landsat satellites, numerous ground stations around the world paid a fee for the right to receive and distribute Landsat data. These ‘international cooperators’ (ICs) received Landsat data of their coverage areas downlinked to their local antennas. Each IC applied processing parameters specific to their data usage and placed the data onto distinctive media storage formats. Over time, more Landsat data was held outside the USGS archive, much of it unique. Recognizing the critical value of this data, the USGS began the Landsat Global Archive Consolidation (LGAC) initiative in 2010 to bring the data into a centralized global archive at the EROS Center. To date, over five million scenes have been received from IC stations around the world, with just over 3.5 million of them being unique additions to the Landsat archive. As of mid-2018, the LGAC effort was estimated to be almost 80% complete.
Next generation of data-delivery and analysis-ready products
In 2016, the USGS reprocessed the entire global Landsat archive into a tiered ‘Collection’ inventory structure. This structure ensures that all Landsat Level-1 products provide a consistent archive of known data quality to support time-series analyses and data stacking, while controlling continuous improvement of the archive and access to all data as it is acquired. The implementation of Collections represents a substantial change in the management of the Landsat archive by ensuring consistent quality through time and across all instruments.
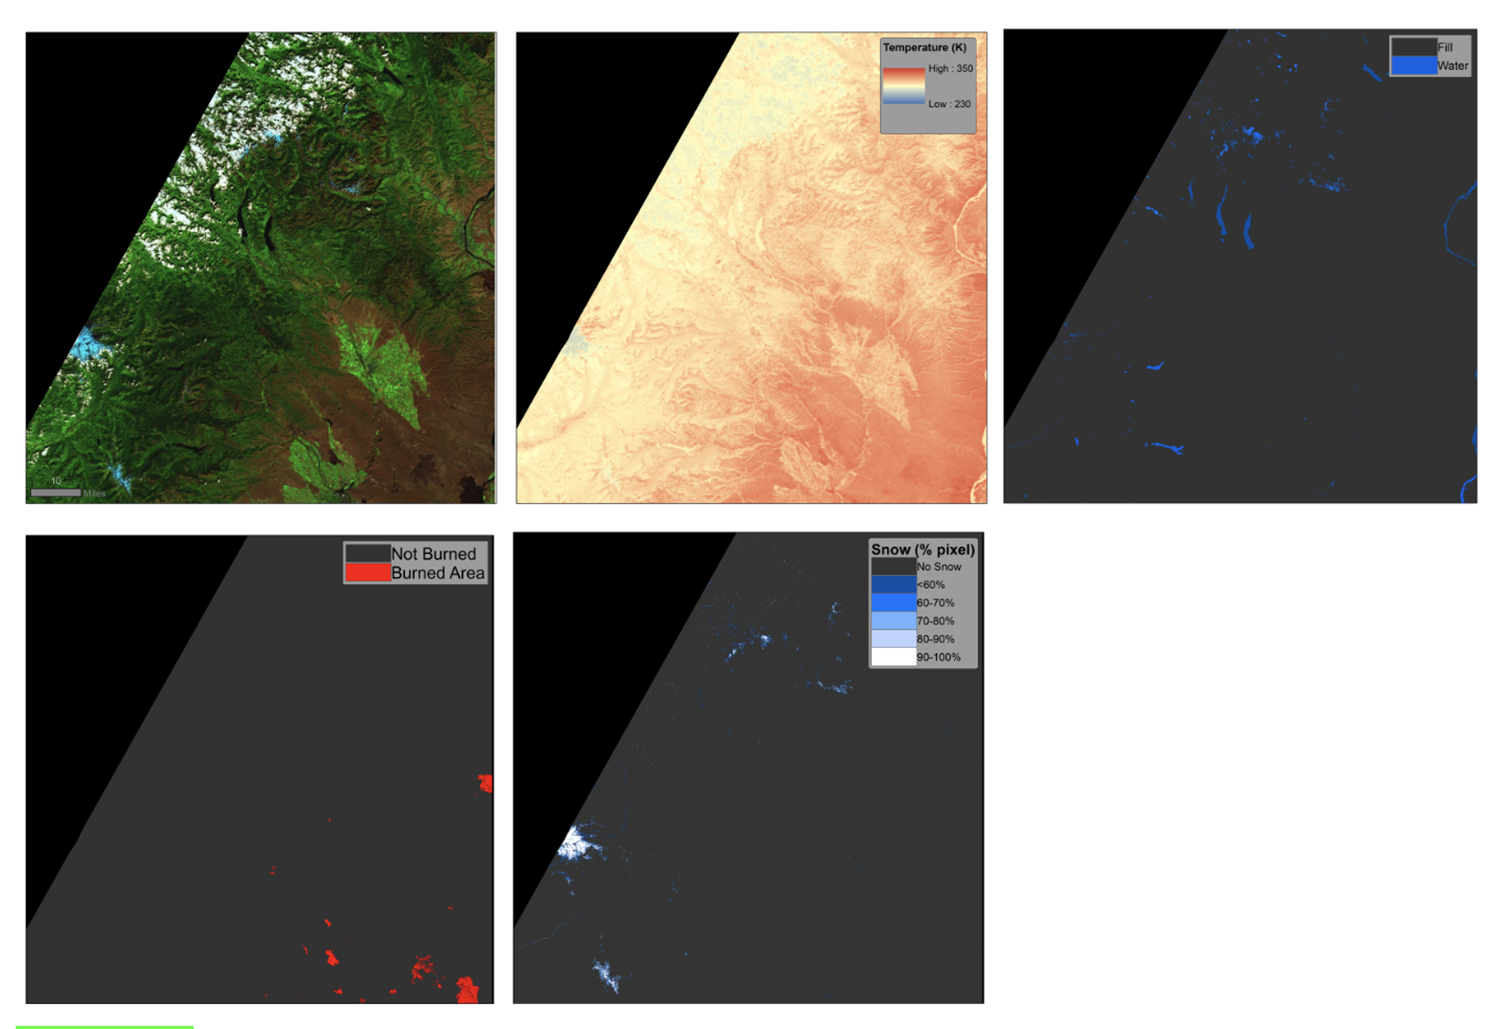
With a Collection inventory structure in place, the USGS released research-quality, applications-ready, Level-2 science products commonly referred to as Landsat Analysis Ready Data (ARD) in 2017. Landsat ARD consists of top-of-atmosphere reflectance and brightness temperature, surface reflectance and provisional surface temperature. A fundamental goal of ARD is to significantly reduce the preprocessing burden of Landsat data, allowing users to easily produce regional and continental-scale Landsat-based maps of land cover, land cover changes and other derived geophysical and biophysical products. In early 2019 the USGS will release a suite of US ARD Level-3 science products. These products span the USGS Landsat archive from 1982 to present and include burned area (representing per-pixel burn classification and burn probability), fractional snow-covered area (indicating the percentage of a pixel covered by snow), and dynamic surface water extent (describing the existence and condition of surface water). Not only do these Landsat science products significantly reduce preprocessing tasks, they also provide a significant advantage to scientists and land resource managers who monitor changes in the USA’s land cover state and condition.
Towards 50 years of observations and beyond
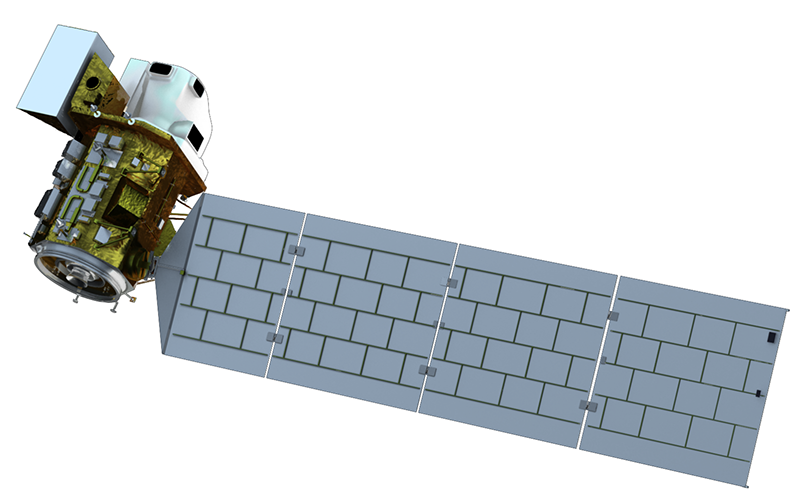
In 2020, NASA is launching Landsat 9, the successor to the still-operational Landsat 8 satellite, to continue the mission of unrivaled space-based Earth observation and lead the Landsat program into a half-century of Earth imagery provided to users worldwide at no charge. Together, both satellites will acquire around 1,500 high-quality daily images of the Earth that will advance research applications, including our ability to map global surface temperature and continuously track and characterize changes in land cover, use and condition. A joint NASA-USGS Landsat Architecture Study Team was established in 2017 to understand how the capabilities of future Landsat missions should look beyond Landsat 9. As with previous Landsats, the team will take into account data user needs as well as new technologies, relevant government policies and commercial and international capabilities.
The success of the Landsat program has inspired the European Space Agency (ESA) Copernicus Program Sentinel-2 satellite constellation, and a new generation of commercial satellite constellations like the RapidEye small-sats, SkyBox small-sats and Dove cube-sats. While these small-sat constellations provide higher spatial resolution and better temporal coverage than Landsat, they have a reduced spatial coverage per image and reduced spectral capability. There will continue to be a need for science-grade, rigorously calibrated satellites like Landsat, but there is an untapped potential to leverage the integration between Landsat and these new emerging technologies.
Current monitoring, assessment and projection initiatives provide scientifically accurate land cover and land change records. Today, it is necessary to use both big data and data cubes and to harmonize Landsat with other international and commercial datasets in order to advance our understanding of the causes – and effects – of natural disasters, urban growth and glacial ice changes for future generations. Landsat’s long-term data record provides an unrivaled resource for observing land cover and land use change over a time scale of decades. Evolving technology, free data and robust calibration have helped make Landsat the cornerstone of global land imaging.


