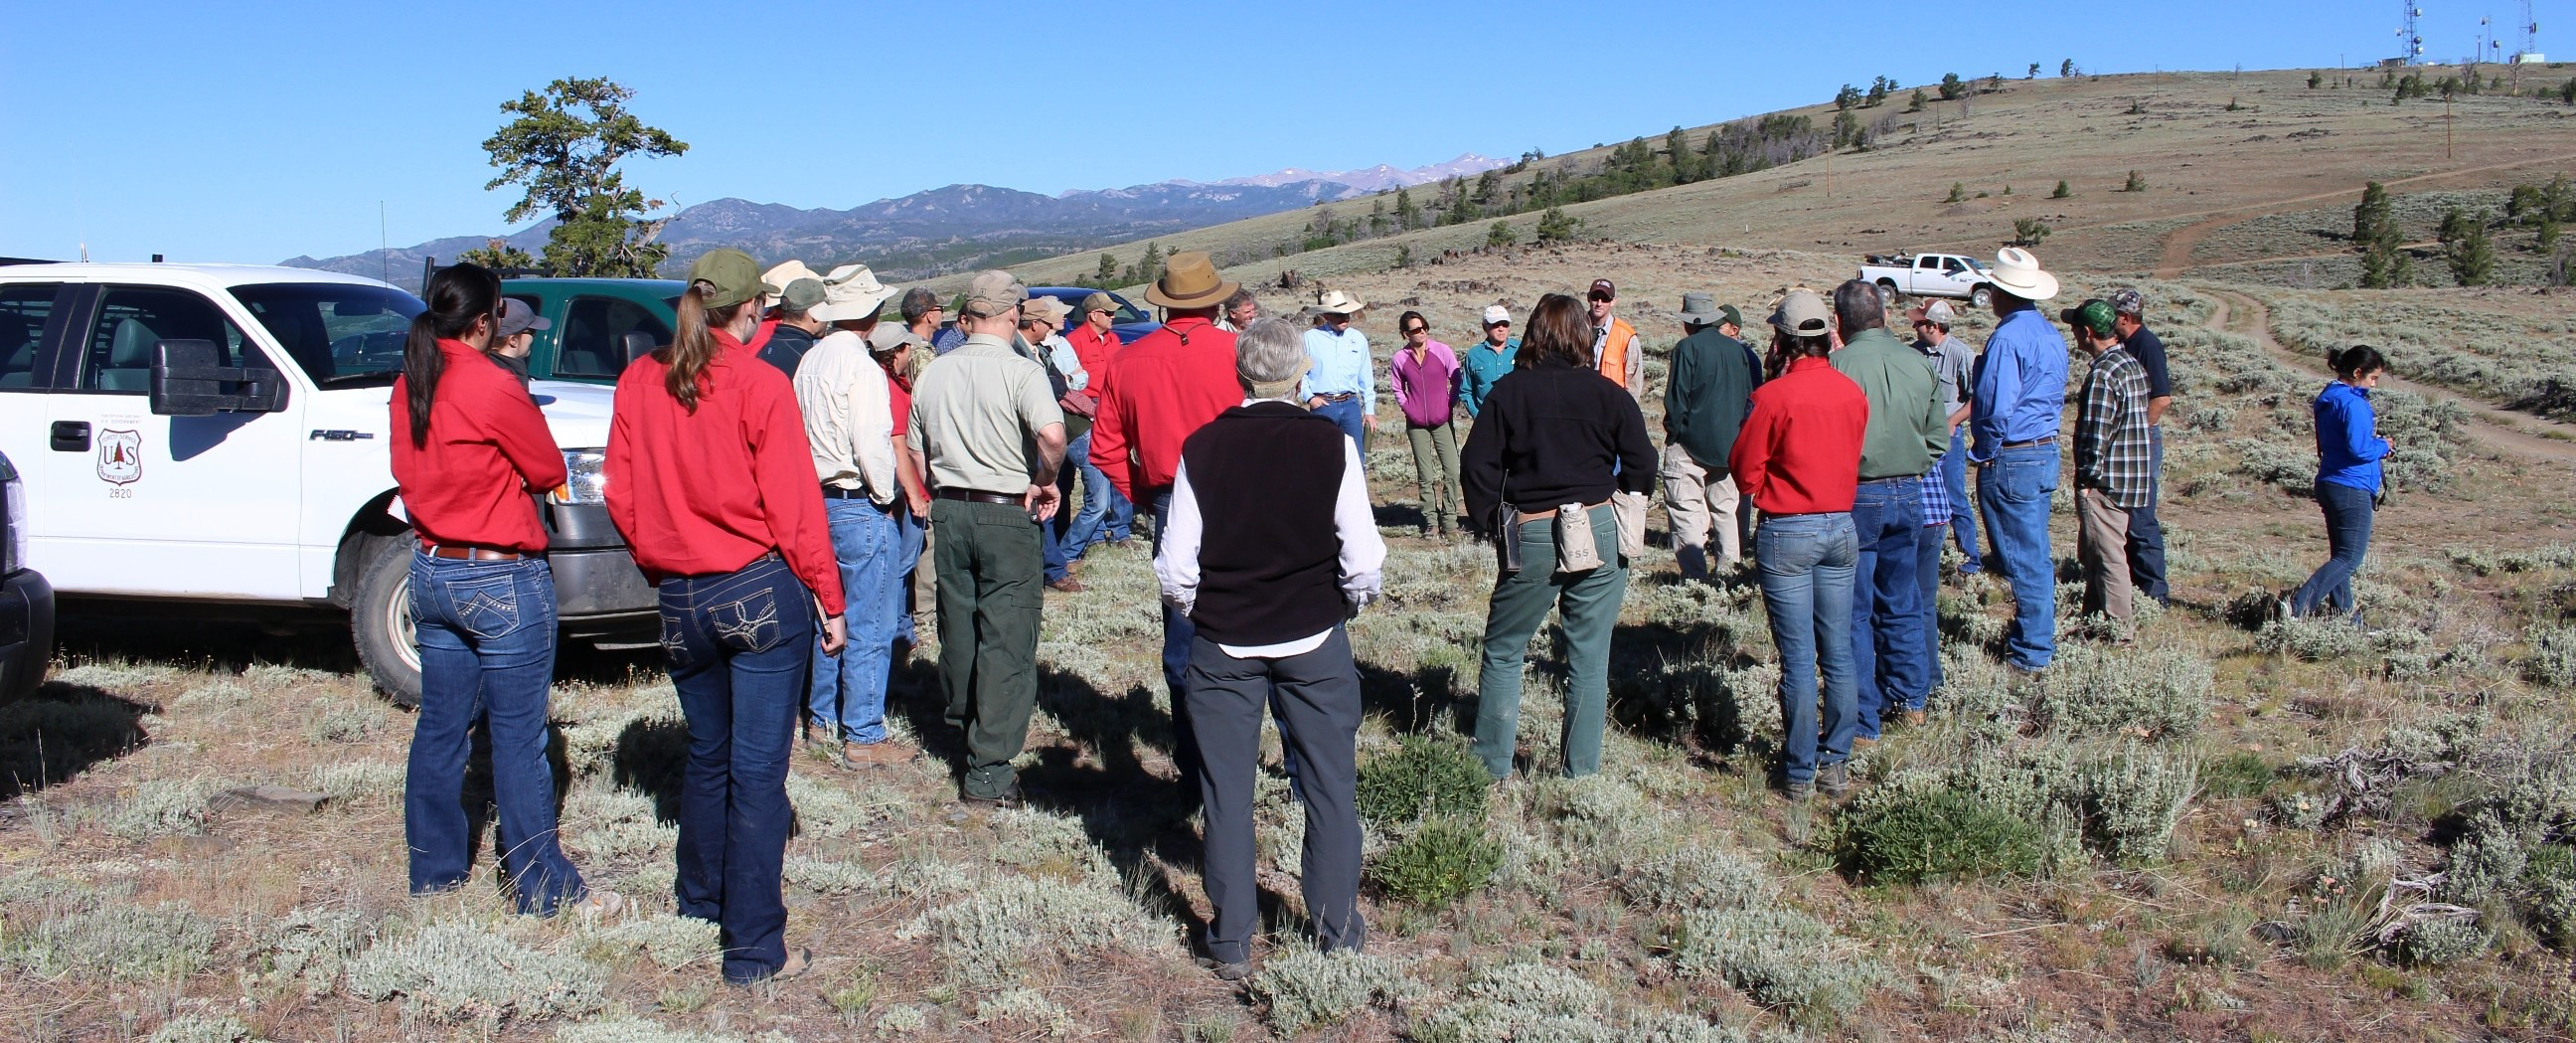
It was a great opportunity for me to communicate my research directly with natural resource managers. However, more importantly it was a chance to spend time in the field with people that really know these systems and begin to understand their needs and how our science might be able to help answer those questions. It was also a chance to get out of my comfort zone and interact with people that don’t spend all of their time thinking about spatial ecology.
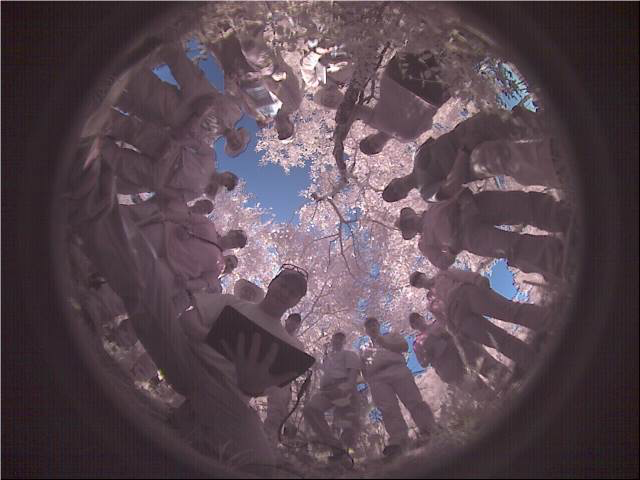
A key component of the research is our ability to connect what we see on the ground with what we see from the sky via satellite imagery. I had a chance to demonstrate the use of the hemispherical (or fish-eye) imaging system in the field and thought I might expand on the process we used to link ground measurements and space based measurements. There are a number of ways to do this, but I”ll present our method here. In a recent study, (Assal et al. 2016) we measured forest canopy condition on the ground via a network of fish-eye photographs designed to measure the amount of leaves, branches and stems in the forest canopy. This metric is known as plant area index (Pfeifer et al., 2012) which can be derived from the fish-eye photos via a gap-fraction inversion procedure (Campbell and Norman, 1989) which measures the amount of radiation transmission through the canopy (Martens et al., 1993).
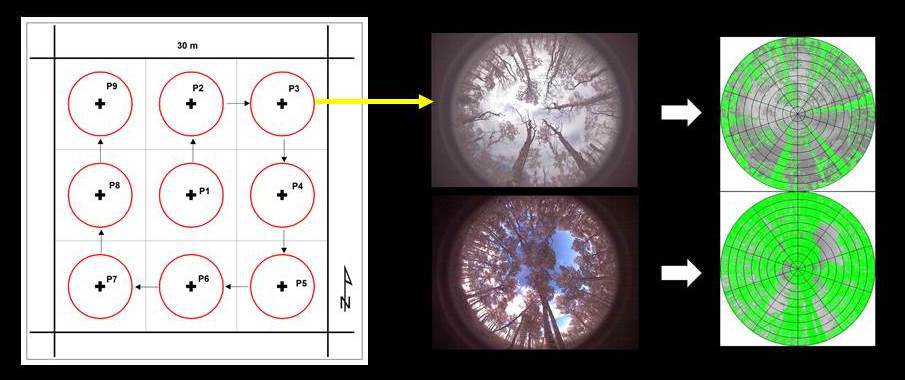
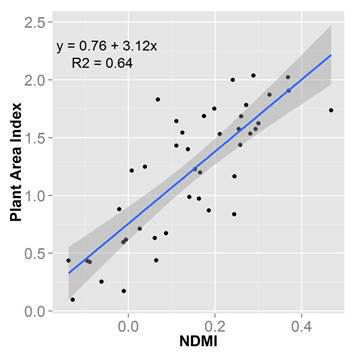
We used Landsat imagery (30 meter spatial resolution) that was collected from a satellite at the same time as our field campaign. To adequately sample the forest canopy, we established a grid of nine photo points in a sample plot, coincident with a Landsat pixel. The information from each plot was used to identify a linear relationship between the amount of plant material on the ground and the amount of plant material measured from the satellite (the Normalized Difference Moisture Index was used as a proxy for amount of plant material). Each point in the plot at the bottom right represents the information obtained from the nine fish-eye photos taken at each sampling location.
References
Assal, T.J., Anderson, P.J., Sibold, J., 2016. Spatial and Temporal Trends of Drought Effects in a Heterogeneous Semi-Arid Forest Ecosystem. Forest Ecology and Management. 365, 137-151.
Campbell, G.S., Norman, J.M., 1989. The description and measurement of plant canopy structure. In: Russell, G., Marshall, B., Jarvis, P.G. (Eds.), Plant Canopies: Their Growth, Form, and Function, Society for Experimental Biology: 31. Cambridge University Press, Cambridge, United Kingdom, pp. 1–19.
Martens, S.N., Ustin, S.L., Rousseau, R.A., 1993. Estimation of tree canopy leaf area index by gap fraction analysis. Forest Ecology and Management. 61, 91–108.
Pfeifer, M., Gonsamo, A., Disney, M., Pellikka, P., Marchant, R., 2012. Leaf area index for biomes of the Eastern Arc Mountains: Landsat and SPOT observations along precipitation and altitude gradients. Remote Sensing of Environment. 118, 103–115.
This post originally was published to Tim Assal’s blog on July 19., 2016. Tim gave special thanks to Amy Anderson and Daryl Lutz (Wyoming Game and Fish Department) for organizing the workshop.