Dec 11, 2019 • Dr. Christopher Soulard is a Research Geographer for the U.S. Geological Survey at the Western Geographic Science Center in California. Chris is the principal investigator for the PLACE Project (PLACE = Patterns in the Landscape–Analyses of Cause and Effect). Here is what Chis shared with us about the work he presented at AGU19 on Tuesday:
Mapping surface water change continuously using the Landsat TM archive
Your team has combined USGS gage station records with two Landsat-based surface water products to create a continuous inundation records for the last 30+ years. Why did you choose to work with these Landsat-based products?
Since the development of the Landsat program in 1972, the USGS has worked with NASA to produce decades of uninterrupted image records. The length of the Landsat archive, spatial resolution, spectral characteristics, and ease of distribution and access were attractive to the PLACE team. Landsat is a fantastic means for making relatively long-term comparisons to gage and climate records.
Did Landsat provide information that would have been difficult to ascertain otherwise?
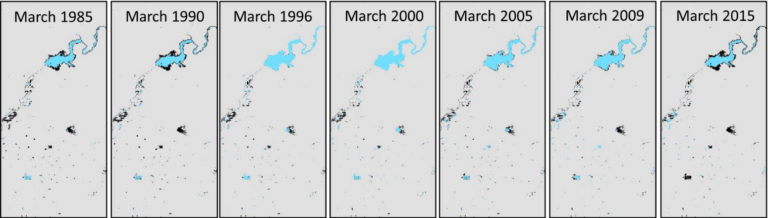
Yes. The European Commission Joint Research Centre has produced a global surface water product based on Landsat time series, which gave the USGS an important and useful basis for understanding surface water dynamics in California at a relatively high spatial resolution.
In time, the PLACE team generated additional surface water maps derived from Landsat to help fill in the temporal record. Water mapping using optical data is of course affected by cloud cover, snow, and overhanging vegetation. So while Landsat has provided plenty of great information, we will also be supplementing our time series with data sources that are recorded more frequently (e.g. MODIS) or image the landscape at different wavelengths (e.g., Sentinel-1) to gain a more complete picture of water dynamics. Unfortunately, no other data stream can match the length of Landsat’s observation history.
How will this new continuous inundation record help quantify the cause of past floods?
Dense time series are being incorporated into new work focused on the role of climate in affecting water conditions in California. One of the PLACE project goals is to identify how major precipitation events cause flood events across the state. Having a baseline of inundations to compare to more recent characteristics will allow PLACE to identify the key land-cover changes that can be linked to altered flooding patterns.
How will it help improve flood predictions?
As USGS moves towards understanding the probability of surface water inundation as a function of streamflow discharge, these methods can be also applied to determine the probability and possible extent of flooding. A more thorough understanding of how the Central Valley landscape has been impacted by the timing and amount of water delivered by storm events and high-elevation snowmelt will allow USGS to make more accurate predictions of flooding in the future.
Co-authors:
Jessica Walker
US Geological Survey
Roy Petrakis
Contractor – US Geological Survey
Further Reading:
+ Landsat at the 2019 AGU Fall Meeting
Anyone can freely download Landsat data from the USGS EarthExplorer or the LandsatLook Viewer.