
Presentation title:
What Can We Learn About Glaciers and Ice Sheets From 30 Years of Landsat Imagery?
What are the major findings of your research?
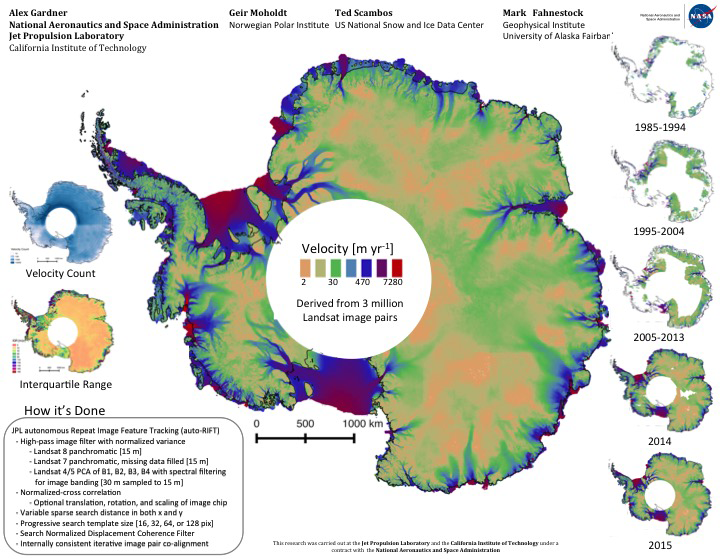
Over the observational record the Antarctic ice sheet has experienced complex changes in its rate of flow from its high elevation interior to the surrounding oceans.
What insight did you gain from Landsat that would have been impossible to glean otherwise?
The Landsat satellites have provided an unprecedented volume of high quality medium-resolution imagery spanning more than 30 years. Without this record it would be exceedingly difficult to place presently observed changes in ice discharge into a longer-term context.
How difficult was it to overcome the issues of multiple Landsat sensors, cloud cover, image saturation, geometric resolution, and data gaps that you encountered?
Very. The extensive archive comes with many warts, especially over low contrast ice covered area. Imagery suffers from banding, saturation, geolocation errors, poor orthorectification in areas where the underlying DEM has low accuracy, changes in pixel resolution and changes in bands between missions. Landsat 8 delivered a real revolution in terms of radiometric fidelity, geometric consistency, and data volume allowing for very dense (in both space and time) reconstruction of surface displacement.
Was your data processing done in-house or using a cloud/supercomputing system such as NASA’s Earth Exchange, Google Earth Engine, AWS, etc.?
We have processed more than 3 million image pairs, all in-house on JPL’s supercomputers. Getting the imagery from USGS to JPL is a continual challenge.
Is there further research you would like to carry out with Landsat?
Our software will eventually process all Landsat imagery over ice covered regions to provide a detailed record of changes in glacier flow over the past 30 years.
Co-authors:
Ted Scambos
National Snow and Ice Data Center
Mark Fahnestock
University of Alaska Fairbanks
Geir Moholdt
Norwegian Polar Institute
Johan Nilsson
NASA Jet Propulsion Laboratory
This research was carried out at the Jet Propulsion Laboratory, California Institute of Technology under a contract with the National Aeronautics and Space Administration. The work was sponsored by the Cryospheric Sciences Program.
Anyone can freely download Landsat data from the USGS EarthExplorer or LandsatLook.
Further Reading:
+ Landsat at #AGU15


