
Presentation title:
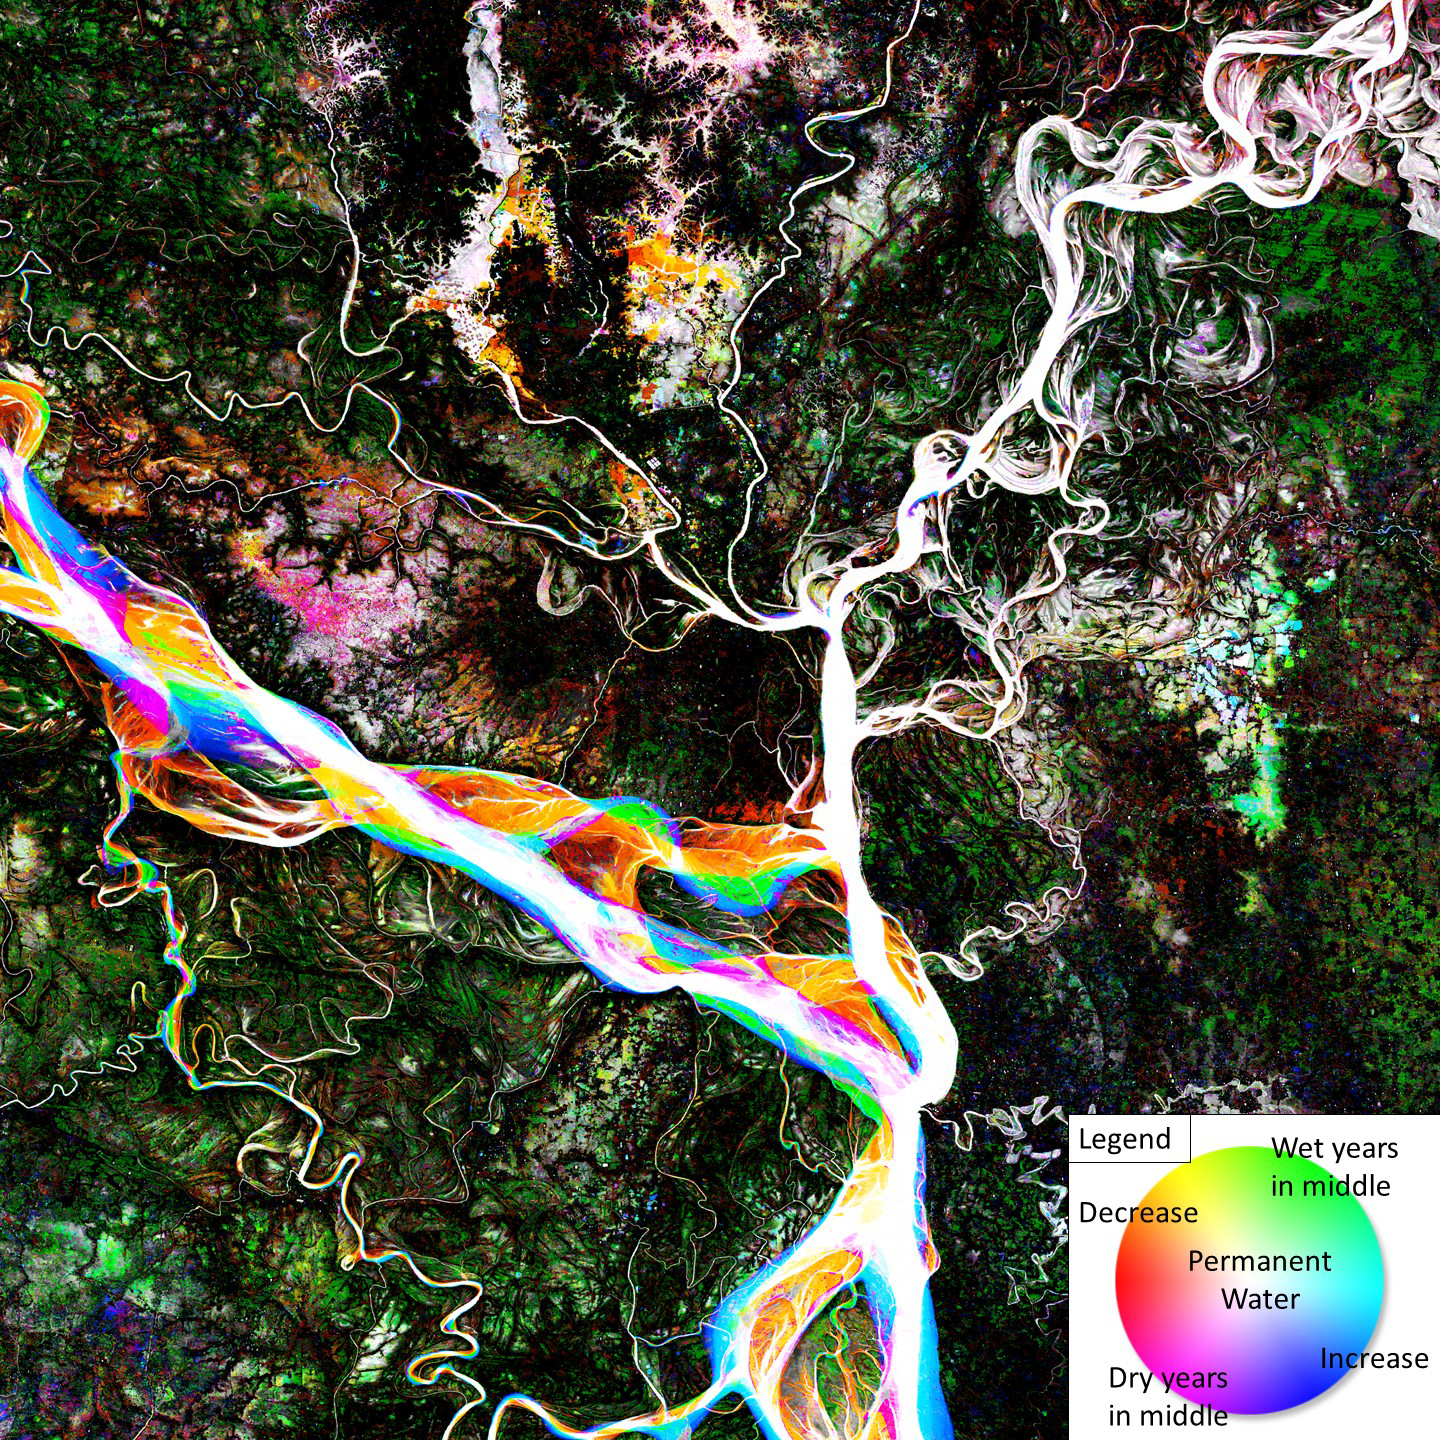
Global 30m 2000-2014 Surface Water Dynamics Map Derived from All Landsat 5, 7, and 8
What are the major findings of your research?
Right now, our findings are limited to methodological advances, but we are test running the product globally this week. This method enables us to cleanly visualize various trends in percent occurrence, and can be applied to any number of years and to other changing land covers. This research also shows how much data we can now process and that it can be synthesized into simple maps.
What insight did you gain from Landsat that would have been impossible to glean otherwise?
Landsat offers a globally consistent data set with a short enough revisit time to allow us to consider the percent of time that surface water is present on an annual and seasonal basis, while its 30 meter resolution also enables detection of smaller ponds and rivers, providing greater connectivity.
Why is it important to know about the ephemeral nature of surface water?
Climatological changes, agricultural exports, constructed constraints, and natural processes all are impacting where water is in the world. Water is critical for human life, agriculture, and ecosystems. A better understanding of where it is and how it is changing will enable better management of this valuable resource and guide protection of sensitive ecological areas.
Does having Landsat data in Google Earth Engine make this work possible?
It is critical. This project is built on classifying all Landsat scenes since 1999, totaling more than 2 million scenes. It would take over a year to process this amount of data with a dedicated server, whereas, Google Earth Engine is able to do this in a few days.
What are the major applications of your data set?
There are many different ways this data set could be applied from identifying the effects of irrigation or newly built dams on a watershed to revealing global trends in surface water change.
Co-author:
Matthew Hansen
University of Maryland
Anyone can freely download Landsat data from the USGS EarthExplorer or LandsatLook.
Further Reading:
+ Landsat at #AGU15


