
Adam Benthem is a hydrologist with USGS. Here is what Adam shared with us about the work he presented today at #AGU18:
Quantifying spatial variations in the environmental effects of oil and gas activity using remote sensing
What are the major findings of this research?
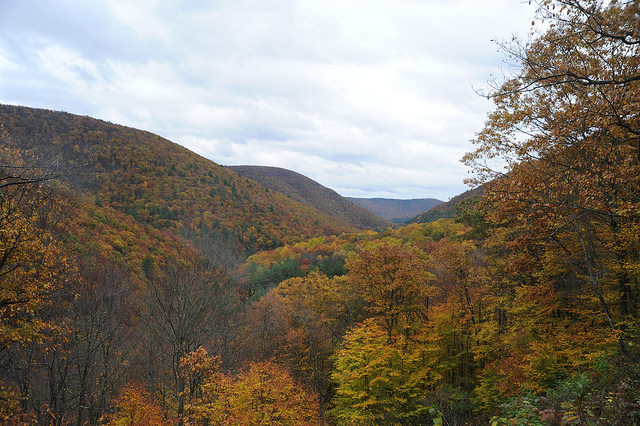
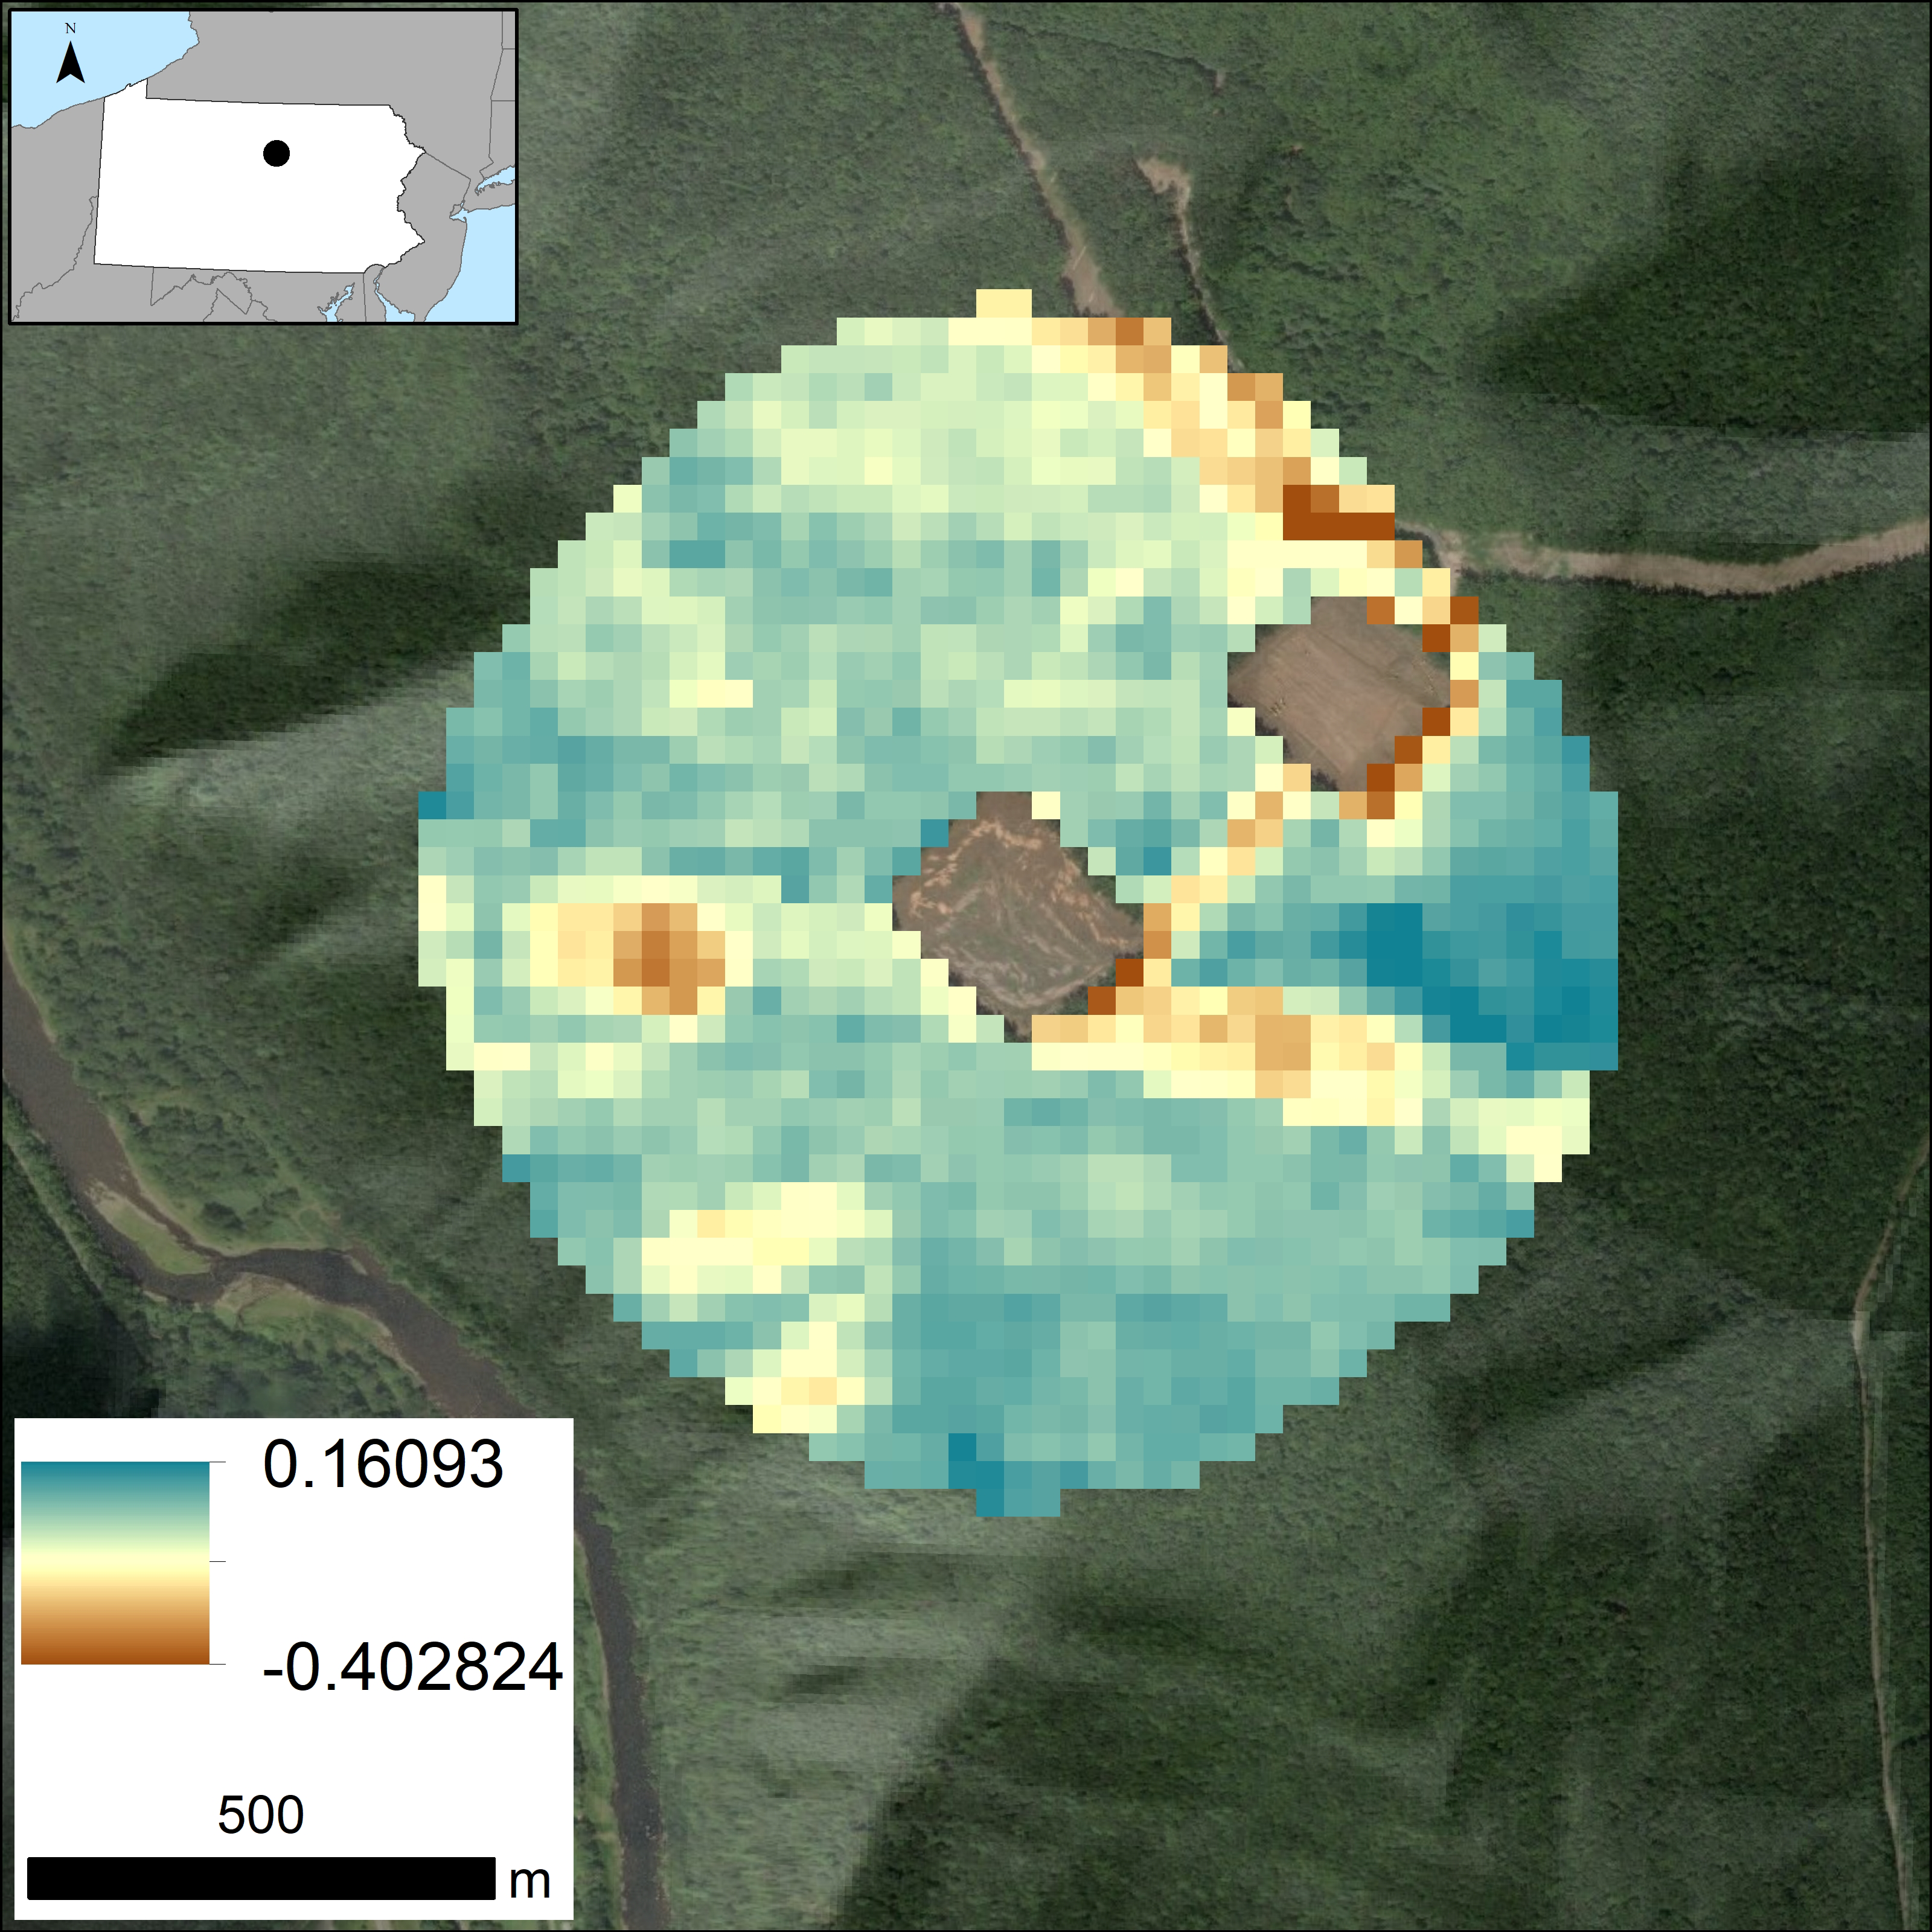
Our research documents the changes in long-term forest health surrounding the 657 oil and gas wells in the Pennsylvania State Forest. Most well pads are associated with a low-level decline in forest health extending 100 to 300m from well pads. The ubiquitous nature of this decline suggests that truck dust, edge of forest effects, or other associated activity may be playing a role.
To assess the possibility that the decline of forest health is a result of accidental releases of produced waters, we measured geochemical and geophysical characteristics of locations high forest disturbance and are correlating the results with landsat generated spatial data. Several of our sites chosen by Landsat showed signs of produced waters.
What are the implications of your findings?
Our research is meant to help land managers assess and monitor a large number of Oil and Gas wells by providing an automated way to assess forest health over time. This allows managers to better deploy more accurate on the ground measurements to locations of concern. Additionally, quantification of normal forest response to industrial activity will allow managers to predict regional scale impact and recovery times associated with oil and gas development as well as help quantify optimal drilling density while preserving overall forest health.
What insight did you gain from Landsat that would have been difficult to ascertain otherwise?
Landsat’s long-term datasets allow this work to be conducted by providing site-specific baseline data over multiple climate conditions for us to assess low-level changes in forest health that would otherwise be impossible to evaluate.
How could long-term vegetation disturbance trends alert you to accidental spills?
Our current work is evaluating the effectiveness of this tool to assess accidental spills. Changes in forest health can have many causes and our results will likely have high error rates. More work is needed.
Co-authors:
Marina Metes
US Geological Survey
Adam C Mumford
USGS
Lyndsay B Ball
USGS Geology, Geophysics, and Geochemistry Science Center
Note: This work is ongoing and these results are considered preliminary only.
Anyone can freely download Landsat data from the USGS EarthExploreror LandsatLook.
Further Reading:
+ Landsat at #AGU18


