Source: Diane Noserale, U.S. Geological Survey

Today, the U.S. Geological Survey (USGS) released the latest edition of the National Land Cover Database (NLCD) for the U.S.—the most comprehensive land cover database that the USGS has ever produced.
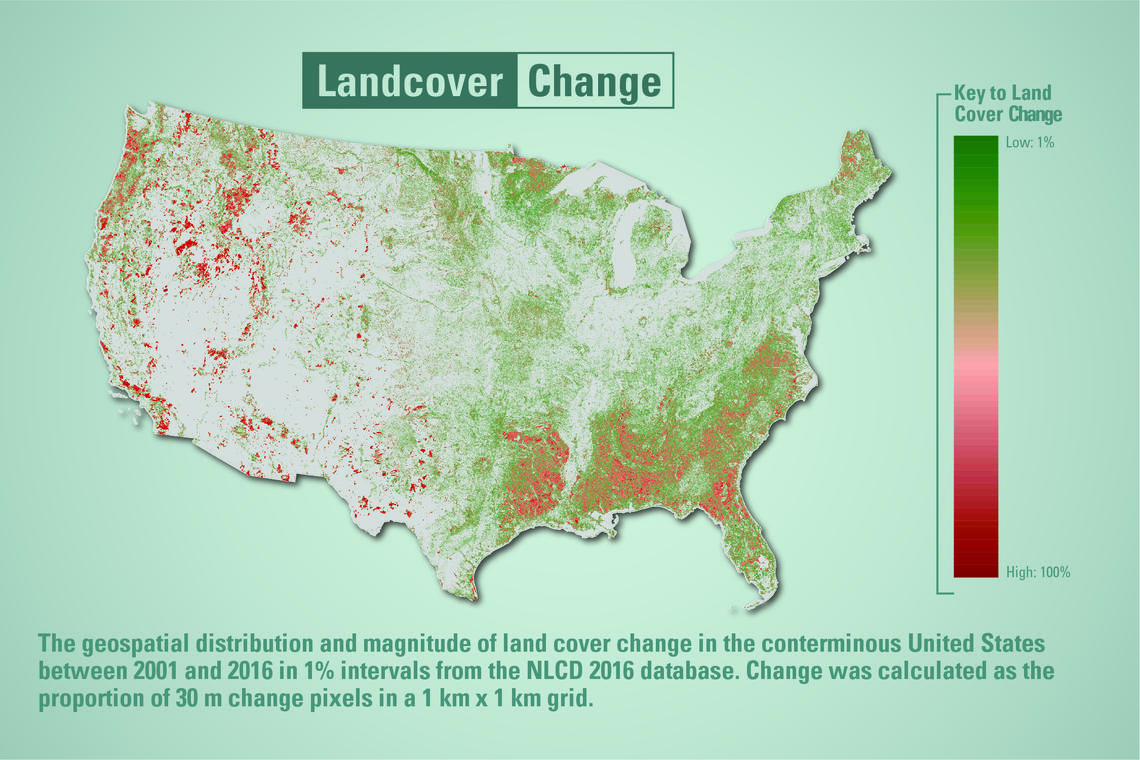
The NLCD 2016 documents land cover change in the Lower 48 states from 2001 to 2016. During this 15-year period, 7.6 percent of the conterminous U.S. changed land cover at least once.
“By far the greatest change across the U.S. since 2001 has been in forest lands—comprising about half of all land cover change,” said USGS NLCD program manager Collin Homer. “Forest harvest and regrowth in the Southeast, and fire, pests and harvest in the West are the causes.”
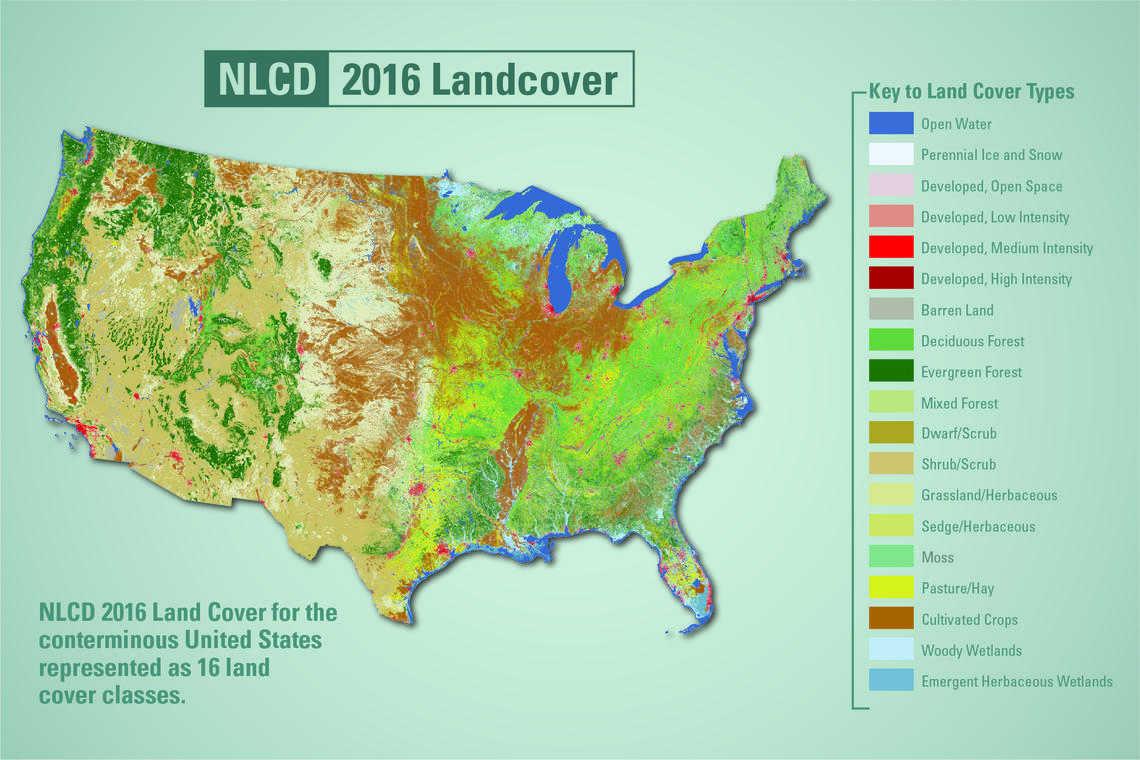
The database includes seven maps that portray the nation’s land cover and class change for 2001, 2004, 2006, 2008, 2011, 2013 and 2016.
The maps sort each 30-meter plot of land across the country into 16 thematic classes such as pasture/hay, deciduous forest or cultivated crops.
The NLCD 2016 also characterizes the fractional proportion of urban imperviousness and tree canopy, and for the first time, shrub, bare ground and grassland areas in the Western U.S.
“Examples of other changing land cover categories from 2001 to 2016 include shrub loss in the West mostly from fire, cultivated crop expansion into grasslands in the northern prairies, and urban expansion across the U.S.,” said Homer.
The NLCD 2016 is based on Landsat satellite imagery taken in 2016.
NLCD 2016 updates NLCD 2011 and provides the nation’s most authoritative look at land-surface conditions from coast to coast. With each update, the extensive NLCD database adds to the understanding of where land cover change has occurred across the U.S. over time.

The digital presentation allows sweeping and detailed views of the nation’s lands that can serve many purposes in science and land management. The range and accuracy of the database enable land and resource managers, urban planners, agricultural experts, and scientists with many different interests to identify patterns of land cover change for a wide variety of investigations and to gain insight about land cover change processes.
Background
The database was developed to meet the growing demand for land cover change data by a variety of user communities.
The NLCD is used for thousands of applications such as studying the impact of wildfires, monitoring ecosystem health, tracking biodiversity and climate change indicators, and defining the rate of urban development.
The USGS is the lead agency for the NLCD; the USGS operates the Landsat series of satellites and archives the satellite data at its Earth Resources Observation and Science Center near Sioux Falls, South Dakota.
The NLCD is constructed by the 10-member Multi–Resolution Land Characteristics Consortium (MRLC) . The decades-long collaboration has proved a model of cooperation among the federal agencies that combine resources to efficiently provide digital land cover information for the nation.
NLCD data can be downloaded free of charge at the MRLC website. The site serves as a hub for NLCD downloads and offers a recently enhanced viewer that allows users to sift through data layers pixel by pixel.
Updates for Alaska, Hawaii and Puerto Rico will be released separately.
Further reading:
+ USGS Land Change Science Program
+ USGS National Land Imaging Program


