
Source: Marine Biodiversity Hub, National Environmental Science Program, Australia
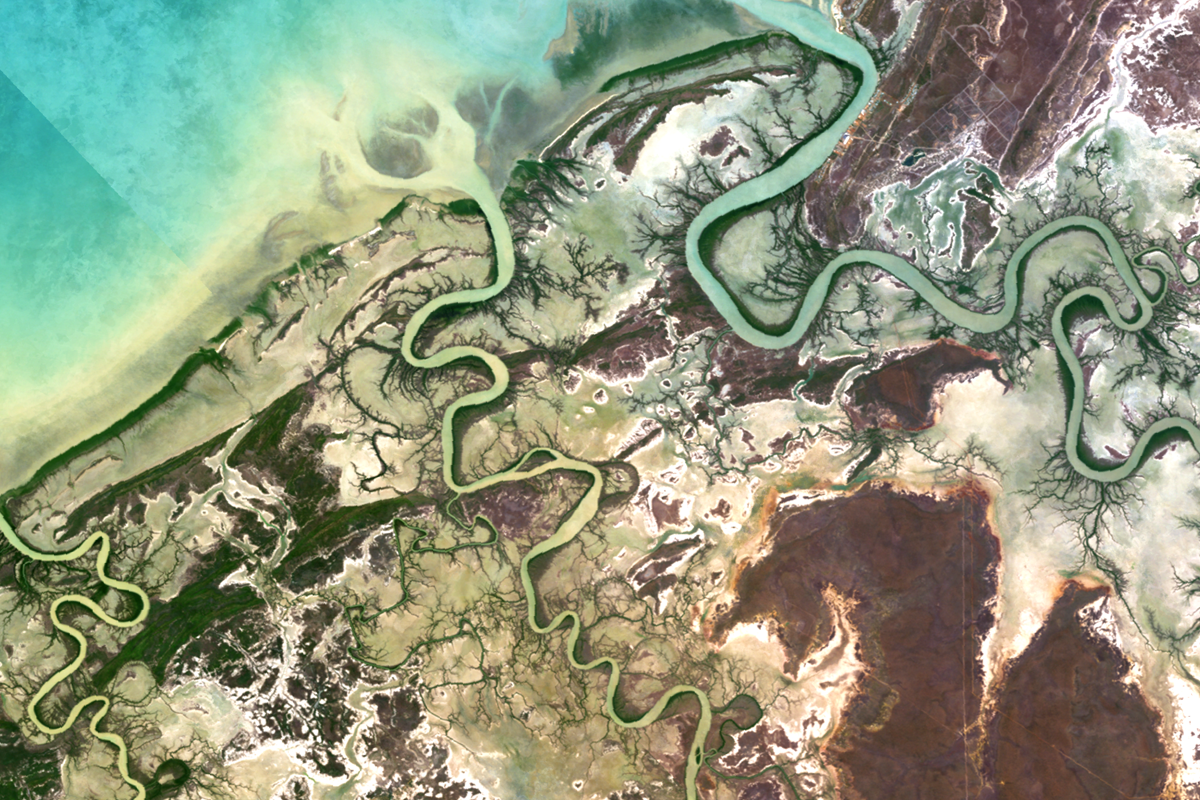
A Marine Biodiversity Hub study led by Geoscience Australia (GA) has used satellite remote sensing imagery to map coastal habitats critical to threatened and migratory species in northern Australia.

The study team tapped into 30-years of Landsat imagery archived on Digital Earth Australia (DEA) for the Keep, Daly, Roper, Macarthur, Flinders and Gilbert River estuaries and Darwin Harbour. All these estuaries provide important habitat for shorebirds.
They used GA’s Intertidal Extents Model (ITEM v2.0), along with a tidal tagging and modelling process, to depict highest and lowest tides and distinguish between tidal-induced and long-term change. To overcome cloud cover, which is a common problem in northern Australia, composite images at different tidal stages were generated from the Landsat time series.
The resulting images show coastal features visible above the water line at each extreme of the tidal range, providing a baseline understanding of the extent and dynamics of critical habitats on the northern coast. Low tide images reveal intertidal substrate types, and persistent islands and sandbars in channels and offshore, while high tide images show the typical extent of the high tide water mark and interacting habitats.

The study found that analysing the long and detailed archive of Landsat imagery provides unique insights into the form, timing and rate of change in estuarine landforms and habitats. While some areas experienced gradual changes, others were associated with specific events. Examples included:
- large-scale rapid island growth and mangrove expansion (such as in the Keep River and Gilbert River estuaries);
- gradual long-term expansion of mangrove (Flinders River and McArthur River estuaries); and
- estuaries with areas of rapid recent die back of mangrove (Roper River and Flinders estuaries).
This cost effective approach could be applied to monitoring vast remote areas, and prioritising field work and other intensive studies, to support the management of key species, and decision-making related to coastal development.
The next step is to validate and classify the Landsat archive using on-ground data. This would provide baseline information for monitoring key threatened and migratory species populations and habitat, investigating changes in habitat and species distribution, and predicting as yet undocumented areas of critical habitat.

How to access the intertidal maps on National Map
ITEM v2.0 and the High and Low Tide Composite (HLTC) imagery, developed as part of Digital Earth Australia provides information on the extent and topography of the intertidal zone. It can be accessed on Australia’s National Map by selecting Add Data, then the Surface Water and Marine/Tidal theme. Data access polygons can also be added, providing easy download access to the ITEM products as well as interactive metadata and graphs.
Further reading
+ Welcome to the Intertidal Zone: Mapping Australia’s Coast with Landsat
References
Sagar, S, Phillips, C, Bala, B, Roberts, D, Lymburner, L (2018) Generating Continental Scale Pixel-Based Surface Reflectance Composites in Coastal Regions with the Use of a Multi-Resolution Tidal Model. Remote Sensing 10: 480. https://doi.org/10.3390/rs10030480
Sagar, S, Roberts, D, Bala, B, Lymburner, L (2017) Extracting the intertidal extent and topography of the Australian coastline from a 28 year time series of Landsat observations. Remote Sensing of Environment 195: 153–169. https://doi.org/10.1016/j.rse.2017.04.009


