by Laura E.P. Rocchio, Landsat Communication and Public Engagement team
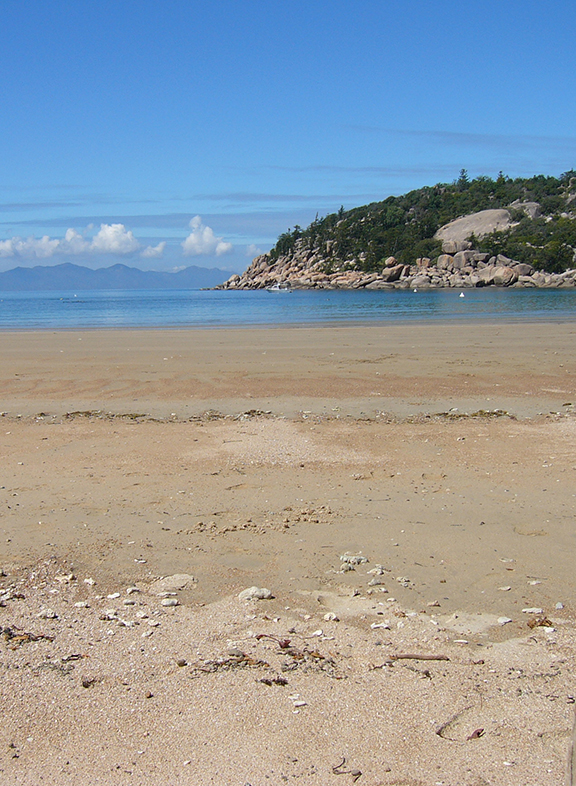
Beachcombers the world over marvel at how the beach grows and contracts with the tide. That beguiling strip of land that the low tide reveals and the high tide conceals is known as the intertidal zone. This zone is a rich ecosystem, as anyone who has peered into tidal pools or chased crabs and searched for shells on tidal flats might guess. It provides habitat for migrating shorebirds and is a first line of defense against extreme storm events, but pressure is mounting on this zone from sea-level rise and anthropogenic sources such as land reclamation and aquaculture.
Land management requires land mapping, but surveying this ephemeral landscape has traditionally been difficult, especially when mapping large expanses of shoreline. But a new and innovative mapping approach may change that.
Using 28 years of Landsat data, an Australian research team has created a continent-wide intertidal zone extent map for the whole of the Australian coast—some 50,000 kilometers (31,000 miles). Using an automated workflow their analysis of Landsat data spanning from 1987–2015 has yielded a map product, dubbed the Intertidal Extents Model, or ITEM v1.0, that is now publically available online.
Dr. Stephen Sagar from the National Earth and Marine Observation Branch of Geoscience Australia led the team that created ITEM v1.0. His team’s mapping breakthrough was made possible by Landsat’s deep archive, a countrywide analysis-ready data storage format, and an innovative data analysis approach.
Landsat 5, 7, and 8 data acquired over Australia since 1987 have been assembled by Geoscience Australia into an analysis-ready format known as the Australian Geoscience Data Cube (AGDC). Within AGDC, Landsat data have been systematically processed into surface reflectance, and gridded into to pixel-based 1º by 1º tiles. The AGDC prototype has since developed into a series of data structures and tools called Digital Earth Australia (DEA), which organize and enable the analysis of large Earth Observation data collections. The pixel-based nature of DEA enables something called ensemble data processing. Ensemble processing can improve data quality by capitalizing on the temporal depth of the Landsat data record. With every pixel to choose from, low quality data (e.g. cloudy data) can be removed and a robust data set emerges.
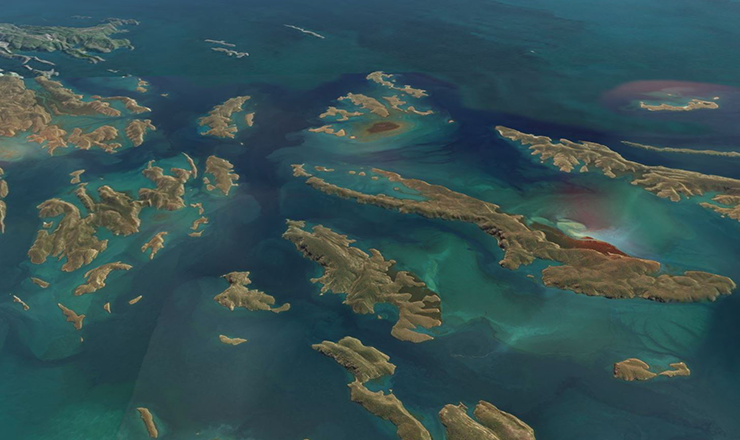
In the case of ITEM, ensemble processing enabled tidal flat extent maps to be made for the first time for Roebuck Bay and the Kimberley Coast, two ecologically important regions in Western Australia where cloud cover had thwarted earlier satellite mapping attempts.
This held for the north as well. As Sagar described: “Having a long and complete data record was vital to enable ITEM’s continental scale approach to be valid in Northern tropical regions where there is often extensive cloud cover.”
The novelty of Sagar’s work is not only that his team’s nationwide intertidal zone map product is a first, but more so that their methodology utilizes an entirely new approach—a “change of time” procedure more commonly found in modern financial models.
By adding a tidal stage attribute for each of the 221 coastal data tiles in the dataset (tidal stage was derived from Oregon State University Tidal Prediction Software, which utilizes 22 years of TOPEX/Poseidon and Jason-1 ocean altimetry data) and knowing the date and acquisition time of each Landsat data pixel, the data could be organized based on tidal stage.
“The Landsat data record has been key to the ITEM methodology,” Sagar said. “Having such an extensive and dense time series of data has enabled us to partition the data into discrete tidal stages, and still be able to deal with issues such as cloud and cloud shadow—that is particularly crucial when dealing with the different conditions we encounter across the continent.”
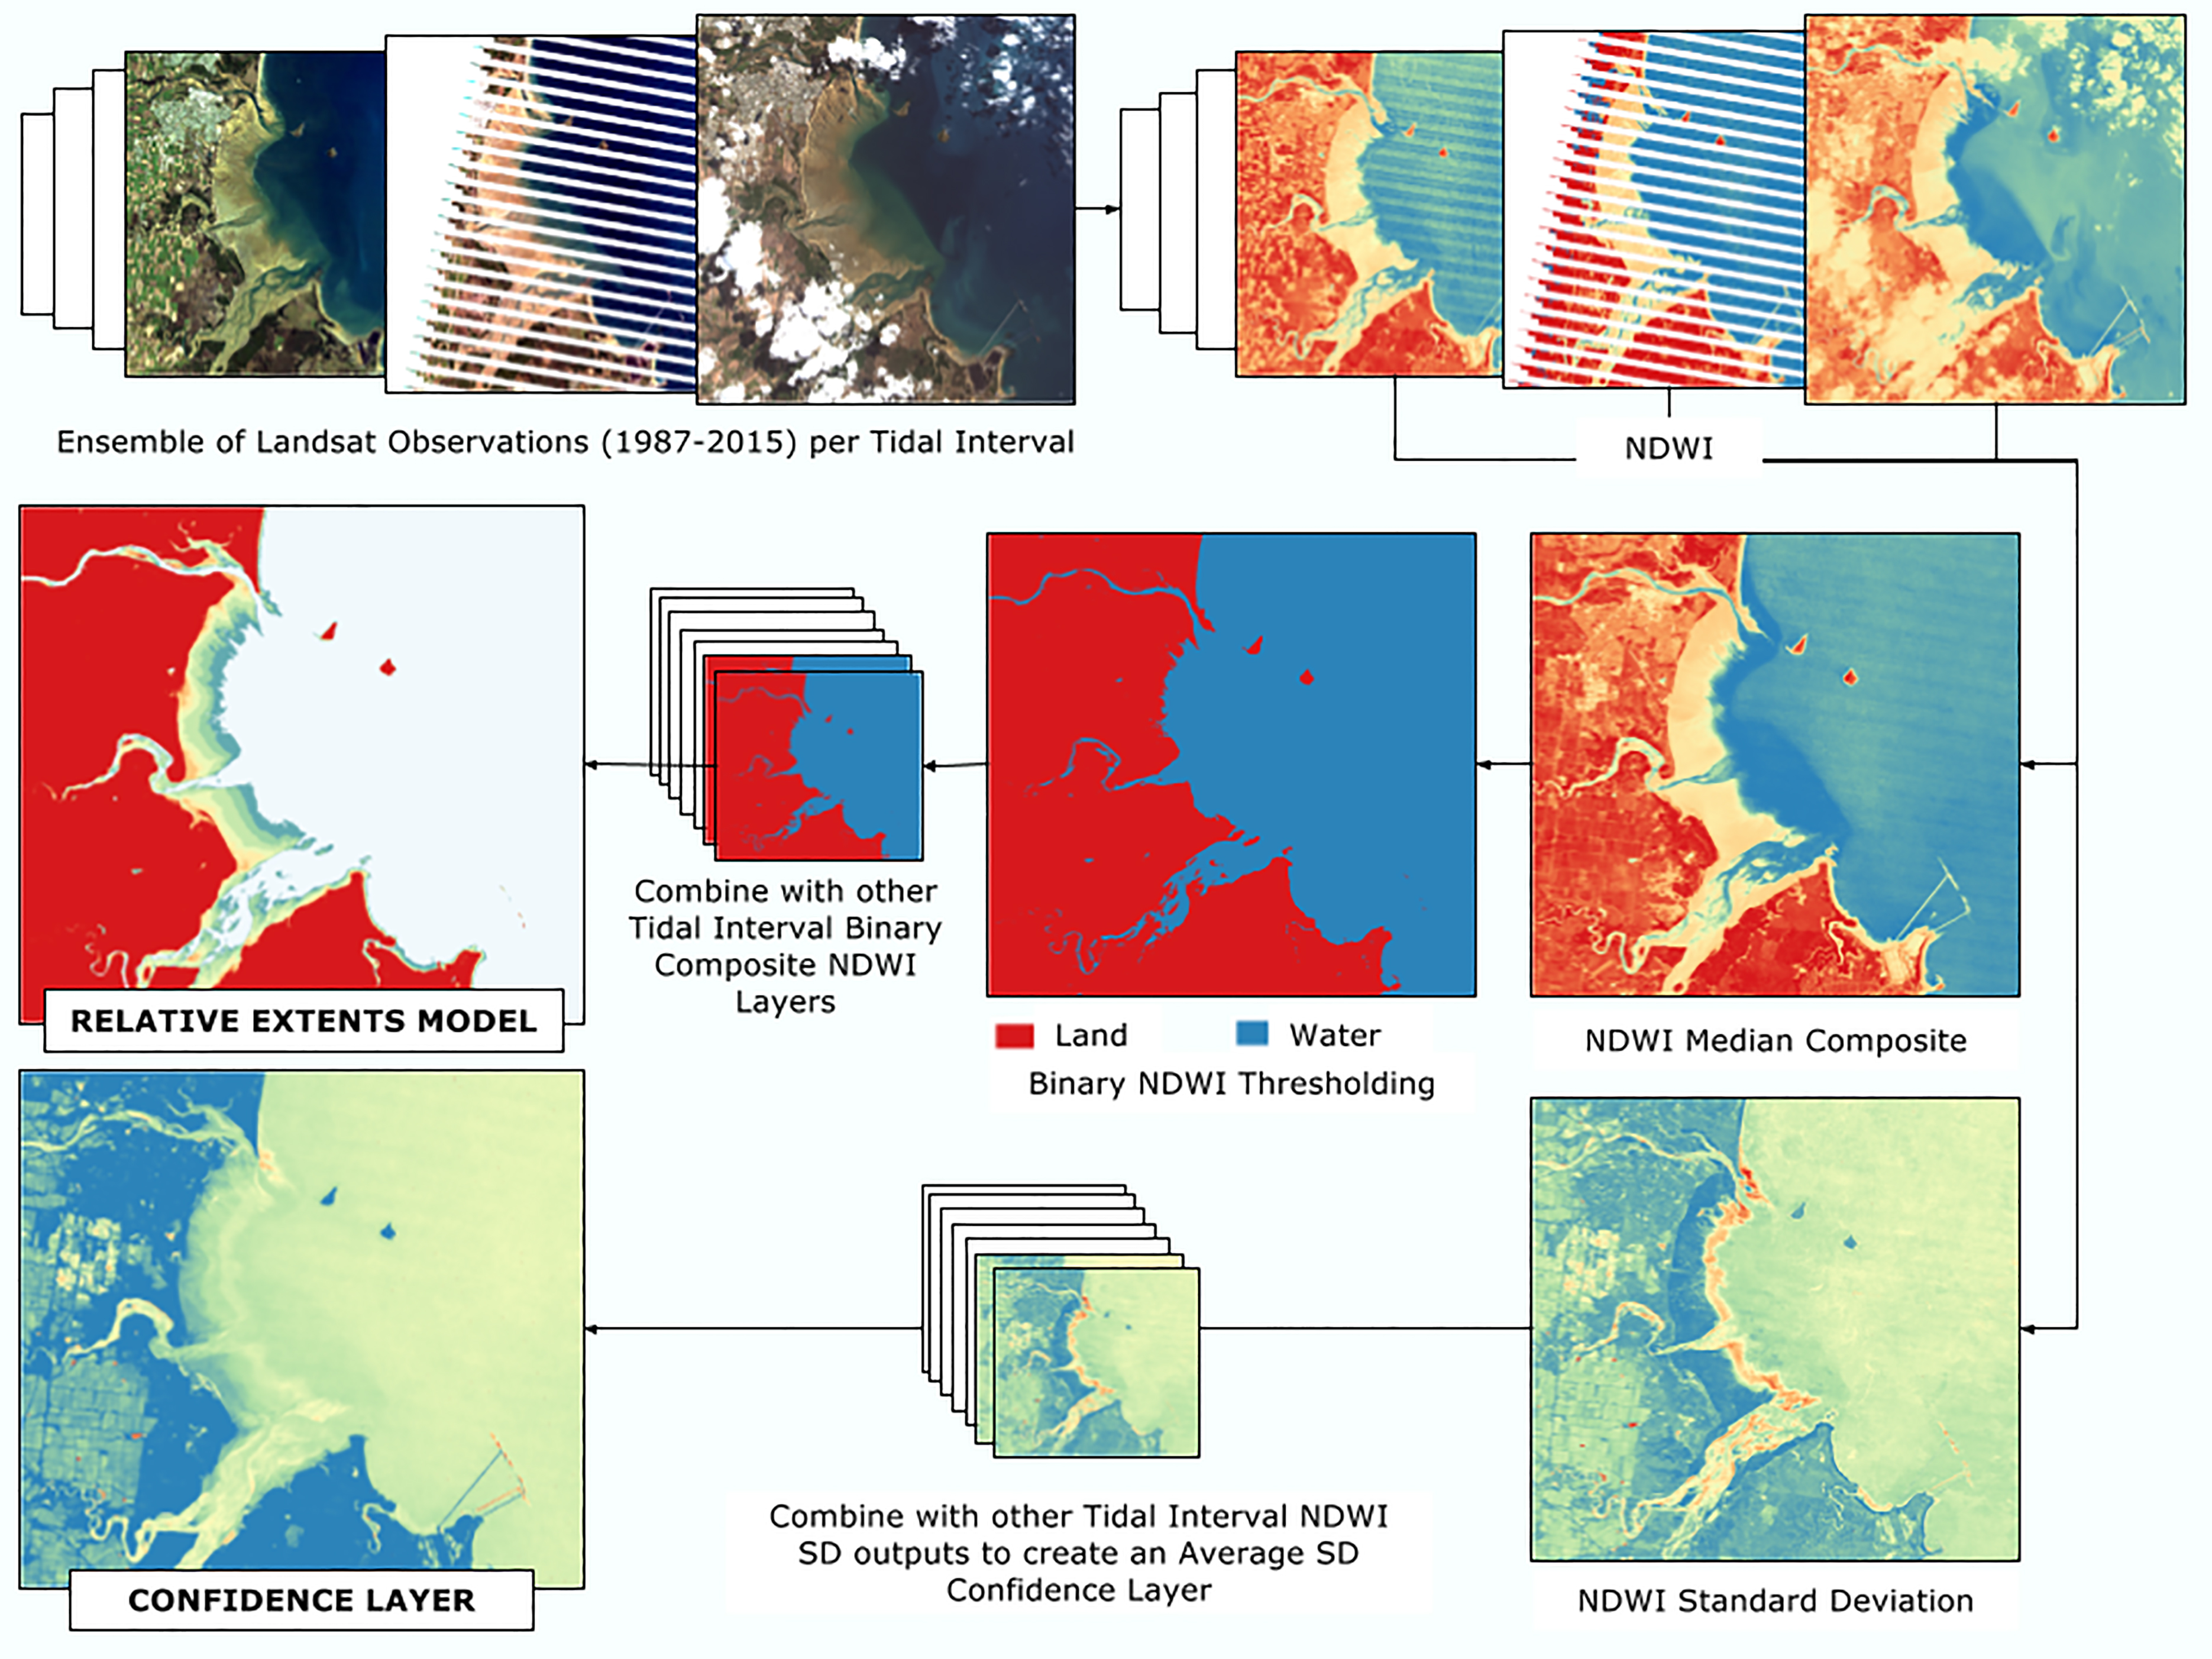
With each Landsat pixel’s tidal stage established, a Normalized Difference Water Index (NDWI) was then calculated to deduce whether or not land in the intertidal zone was covered with water at that tidal stage.
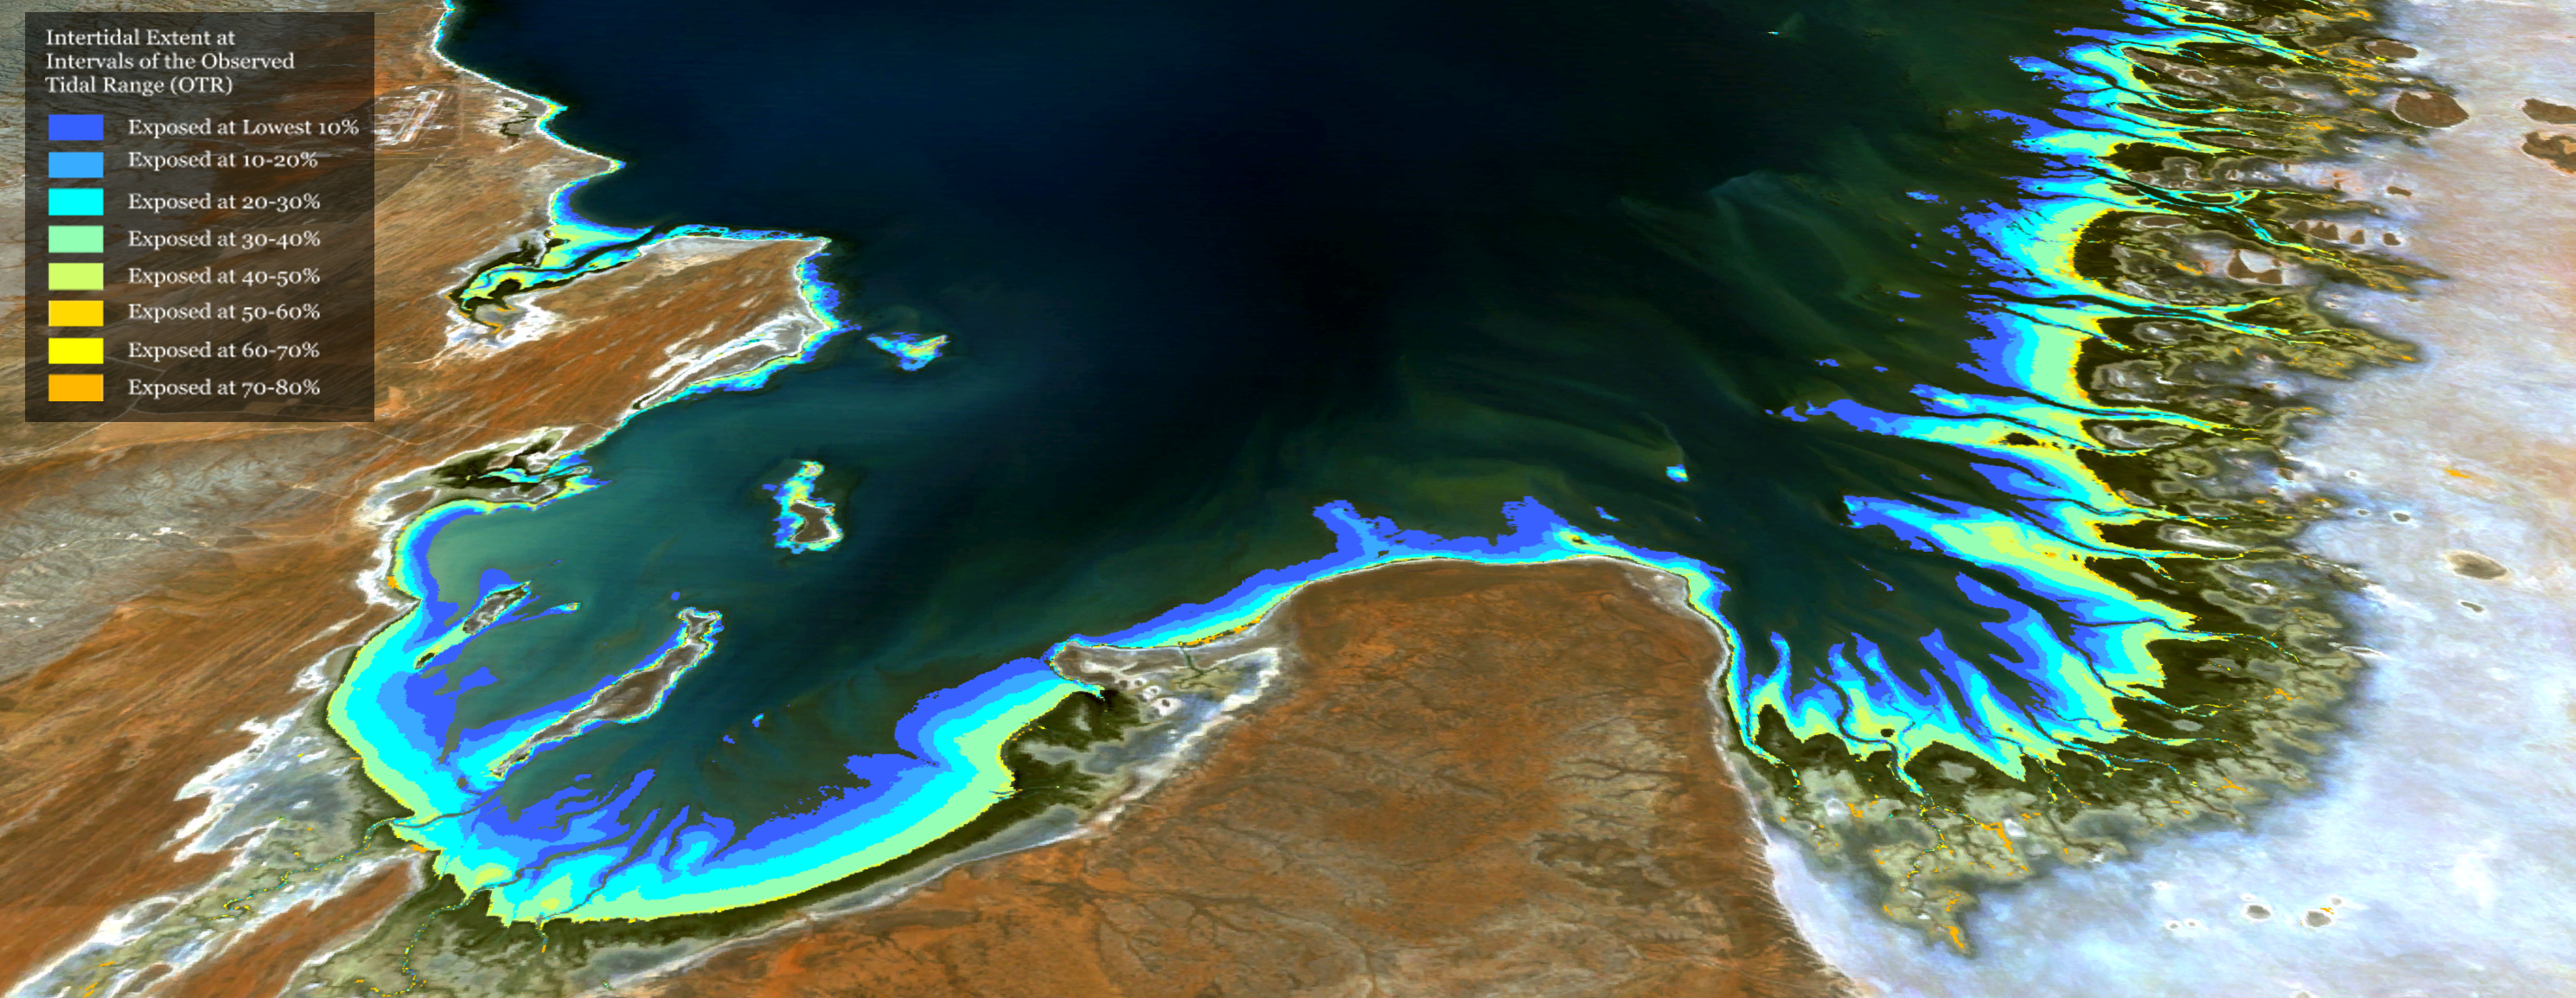
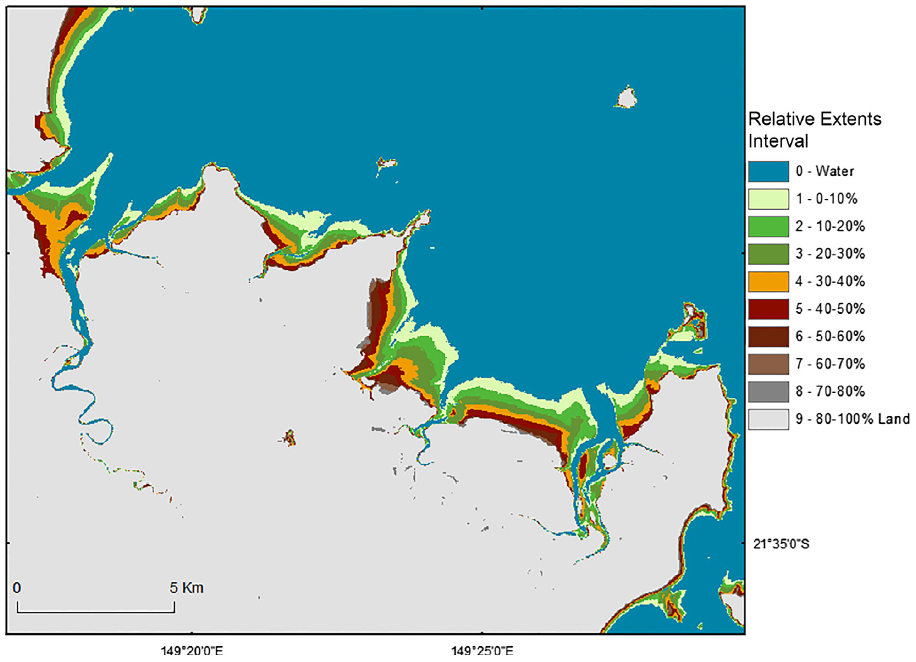
On average there were over 850 Landsat observations for each 25-meter square location (pixel) in the coastal study area. Those observations were sorted by tidal stage and then binned into nine categories starting from the lowest 10% of observed tidal range and so on in 10% intervals until the ninth interval which included the highest tidal stages from 80–100% of the observed tidal range.
With the all observations sorted by tidal stage, the team could then take each pixel’s median-based NDWI value for every tidal stage category and thereby create nine maps of wet / non-wet land (one for each tidal interval).
Combining the resulting nine maps yielded the first continent-wide tidal extent map for Australia. And because tidal extent is a function of the tidal range and the shoreline elevation, the data set also provides relative topography, allowing the researchers to derive coastal elevation models which may prove useful for future hydrodynamic modeling (used for applications such as current forecasting).
By using the entire Landsat time series for the Australian coast and their “change of time” data interpretation approach, a new and important data set has been created—one that will only improve as future Landsat data is added to the DEA.
The researchers expect that their intertidal extent maps will contribute to coastal environmental monitoring, habitat mapping and geomorphological studies.
“ITEM is already being used by the Queensland government to assist in their intertidal and subtidal habitat mapping program for central Queensland,” Sagar relayed.
And through collaboration with James Cook University, ITEM has contributed to the development of the Northern Australian 100-meter bathymetry grid, a water depth chart sourced from all available bathymetry measurements for the region.
“ITEM has been able to provide topographic and elevation information in this remote region of Australia, characterized by large tidal ranges and extensive intertidal regions,” Sagar explained. “Many of these regions were previously unmapped.”
Reference:
Sagar, S., Roberts, D., Bala, B., Lymburner, L., 2017. Extracting the intertidal extent and topography of the Australian coastline from a 28 year time series of Landsat observations. Remote Sensing of Environment 195, 153–169.