
The world over, a tiny organism is causing a big problem. Cyanobacteria, unicellular algae that live mostly in fresh water, are growing in abundance. When this booming growth occurs, the resulting algal blooms can be a nuisance to people, plants and animals, or worse—toxic. Satellites, including Landsat, are being harnessed to track these harmful algal blooms because water managers across the globe need to know when and where blooms are happening to protect people.
Cyanobacteria’s harmful algal blooms are responsible for a laundry list of water woes. Here are just a few examples:
- In 2014, a three-day “Do Not Drink” order in Toledo, Ohio caused a loss of drinking water for nearly half a million people.
- In Florida in July 2018, seven counties were placed under a state of emergency because of widespread harmful algal blooms. Two years prior, “guacamole-like” algae blooms caused a four-county state of emergency and the surface water of some lagoons were completely obscured by the upturned white bellies of thousands of dead fish.
- In 2016, the entire 150-square mile Utah Lake was closed to recreation for the first time in history.
- For two brief periods in May and June 2018, Salem, Oregon issued “Do Not Drink” advisories for vulnerable populations after harmful algal blooms were identified over the city’s Detroit Lake water intake.
- By mid-summer 2018, fishing, boating, and swimming had been intermittently banned in lakes and reservoirs throughout the U.S., including Diamond Valley Lake in California and Lake Pontchartrain in Louisiana. Even the lake in Central Park had a bloom status listed as “confirmed with high toxins.”
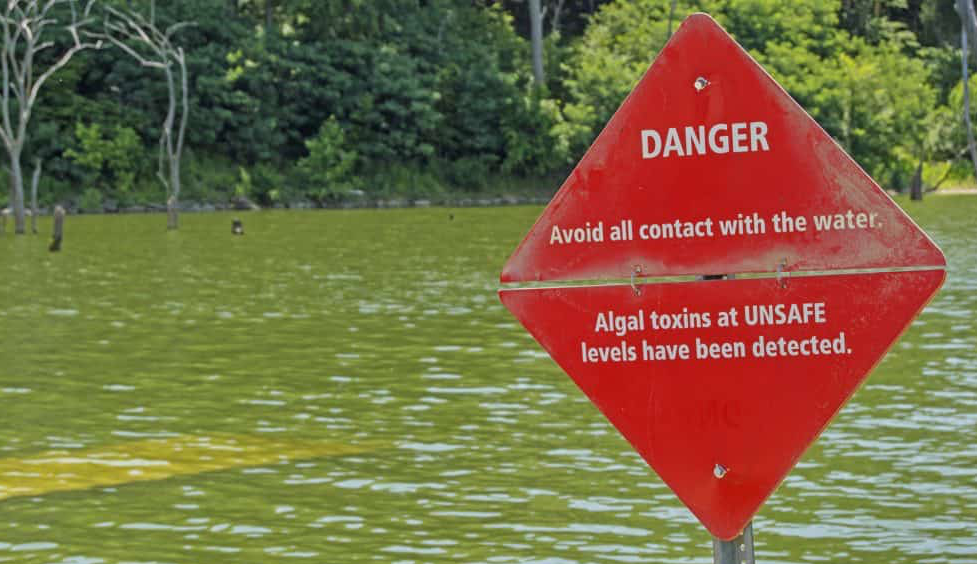
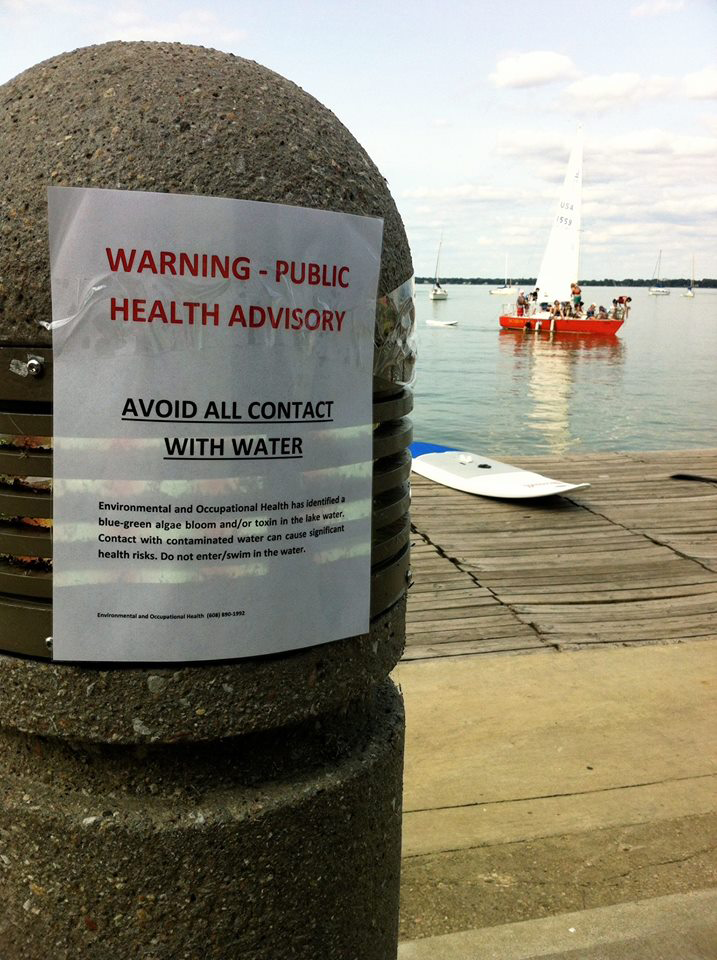
The cyanobacteria that cause harmful algal blooms (HABs) can create toxins responsible for an array of human ailments. The list is long: headaches, diarrhea, stomach cramps, nausea, vomiting, neurological impairments, respiratory ailments, swimmer’s itch, rashes, and compromised liver and kidney functioning. Pets that drink cyanotoxins can become sick and die. Ecologically, HABs can be devastating, poisoning wildlife and prompting advisories not to eat exposed fish and shellfish. And hazardous and non-hazardous algal blooms alike can create oxygen-deprived “dead zones” in the waters they occupy once they reach high concentrations.
Increasingly, water managers are turning to satellites to monitor inland waters. Landsat is among the satellites being tapped to give mangers a full picture of where and when harmful algae blooms are affecting their lakes—providing a map of this growing cyanobacteria problem. To safeguard human health and the environment, water managers must be ever vigilant, spot checking their waters for HABs. They need timely information about their lakes, ponds, and reservoirs to make the right call, because keeping people safe from HABs often means depriving them of access to their recreational and drinking waters. This is a big job. In the U.S. alone there are 17 million hectares (over 65,000 square miles) of fresh water and spot checking alone cannot give mangers a complete picture of the health of their water bodies.
Don’t Feed the Algae
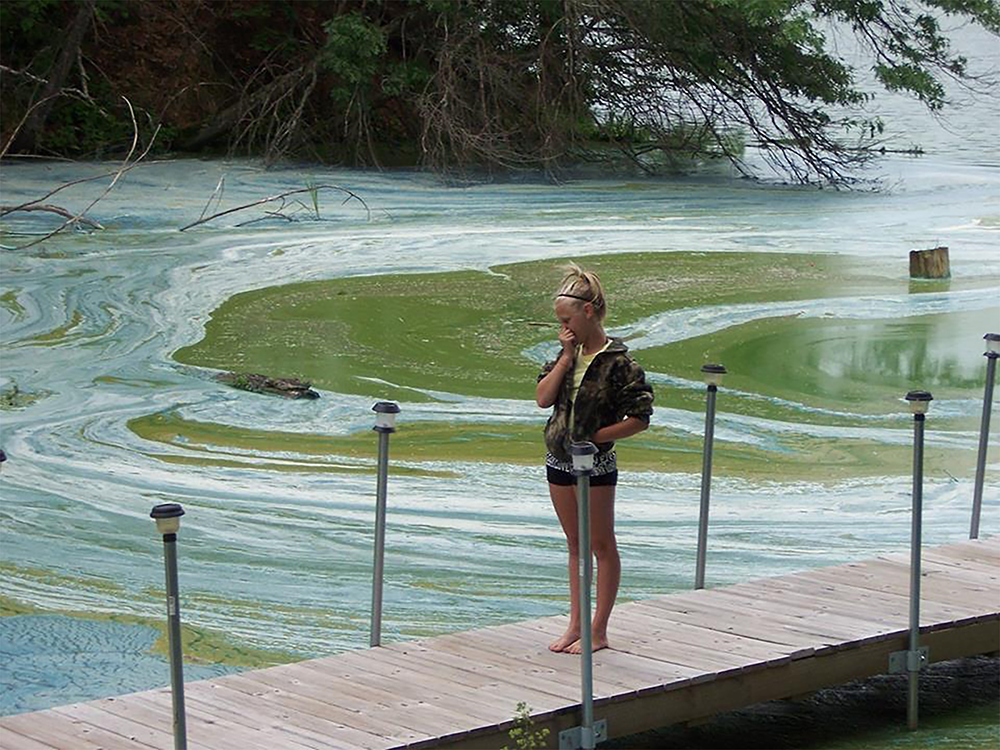
Cyanobacteria are naturally present in waters, but usually at levels that don’t create a threat. When conditions are right, they grow quickly and their toxins become overabundant. When this happens, cyanobacteria grow dense enough to be visible to the naked eye, turning into what is often described as slimy goop, scum, or “pea soup.” Even when no toxins are present, this unsightly surface scum can cause waters to smell bad and taste bad.
More and more often, conditions are right.
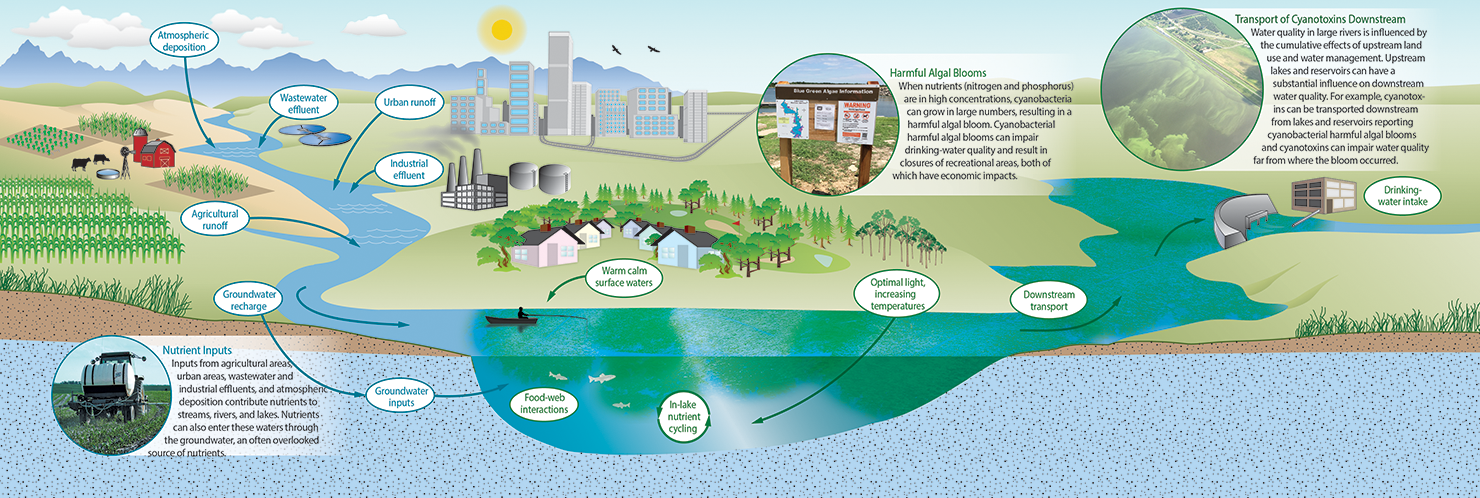
A combination of warm, still waters, lots of sunshine, and plentiful nutrients can lead to a bloom. Inadvertently, we are feeding cyanobacteria with the fertilizers we put on crops and lawns. Rains wash these nitrogen and phosphorus nutrients into streams and rivers, turning them into arteries delivering food to cyanobacteria.
As the nutrients feed the growth of cyanobacteria, the possibility of an algal bloom grows. A quarter of all U.S. freshwater water bodies suffer from this type nitrogen and phosphorus pollution. At the same time, our climate is warming— and warming lakes along with it. As nutrient-rich, warm waters increase so does the likelihood of a bloom. The U.S. Environmental Protection Agency estimates that somewhere between 30 to 48 million Americans use drinking water from lakes and reservoirs susceptible to HABs. Conventional water treatment methods have improved their ability to filter cyanotoxins over the last decade, but they can still be overwhelmed during severe bloom events—and cyanotoxins can’t be boiled away.
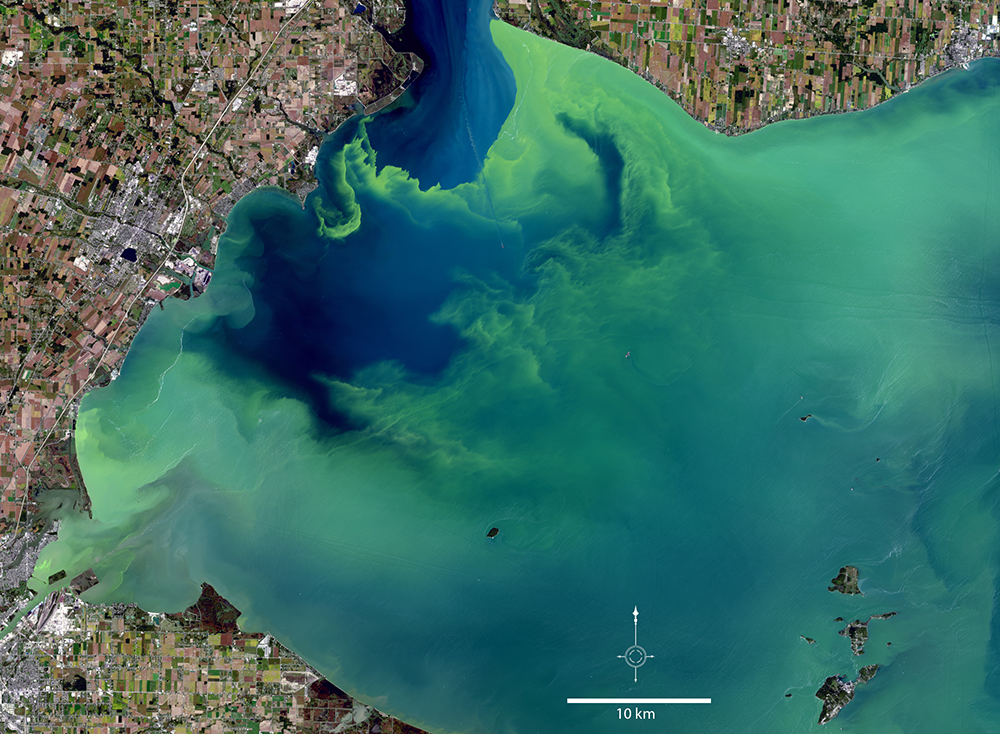
Blooms in Lake Erie, which provides drinking water to 11 million people, prompted the U.S. and Canada to agree in 2016 to take measures to reduce phosphorus going into the lake by 40%. They want to stop feeding the algae.
As decision makers grapple with the best ways to make conditions less favorable for cyanobacteria, water managers, with limited resources, need to know day-to-day where blooms are to keep people safe. Satellite-based alert tools are part of their solution.
The Color Cyan
Cyan is a color between blue and green, and it lends its name to both cyanobacteria (also known as blue-green algae) and the colorless, odorless, and dangerous cyanotoxins that some contain. When harmful algal blooms occur, they color the water, and satellites can observe those color patterns.
Not all algal blooms contain cyanobacteria and it is only some species of cyanobacteria that produce cyanotoxins—and these cyanotoxins cannot be directly detected from space. Satellites help by providing bloom maps that may inform managers when and where to directly sample and test waters for any lurking cyanotoxins.
Those samples are then sent to labs to determine if cyanotoxins are in the water. Microcystin, a liver toxin that causes gastrointestinal ailments, is among the cyanotoxins managers track.
Satellites provide the big-picture view of algal bloom patterns by making quantitative measurements of the color of the water, which is directly related to absorption of light by the pigments that algae use in photosynthesis. They can also measure water’s surface temperature and estimate the amount of suspended matter and dissolved organic matter that water contains. These metrics add to managers’ informational arsenal against HABs.
Early Warning, Satellites and Solutions
Tracking and predicting the movement of cyanobacteria in inland waters is a complex problem. Specially-designed ocean color satellites have tracked ocean algae for decades. These sensors make many measurements in the visible spectrum, including a narrow band of red light (620 nanometers) that can provide a telltale sign of the presence of cyanobacteria. But their spatial resolution, while appropriate for ocean monitoring, is often too coarse for the inland waters where HABs pose threats to humans. So, in addition to ground-based measurements, scientists are using an array of land observation satellites with finer spatial resolution, each sensor adding a needed measurement to create a future operational algae alert product.
“No one technology is going to be the silver bullet, there is no one solution fits all,” explained Dr. Blake Schaeffer, a research ecologist with the U.S. Environmental Protection Agency. “Each technology has its pros and cons.”
Landsat is contributing to these products in three main ways. The first is with its spatial resolution.
Researchers found that by using Landsat, with its 30-meter spatial resolution, they could monitor 170,240 (62%) of lakes and reservoirs in the U.S., including, approximately 95% of the public water surface intake locations, where water for public drinking water is sourced.
“That’s where Landsat comes in with its power of resolution and the number of water bodies it can resolve,” Schaeffer noted.
Thermal measurements are another contribution that Landsat is making to cyanobacteria tracking. HABs typically occur when waters are warmer. By using Landsat’s thermal measurements to monitor surface water temperatures researchers can establish where conditions are favorable for HABs.
Landsat’s long historical archive is also an asset.
Landsat has been collecting 30-meter data since the early 1980s. Using this data, researchers were able to go back and establish algal bloom patterns since 1984 for Lake Erie, expanding the known record of bloom occurrence by two decades and helping scientists understand long-term algal bloom trends, distribution, and timing, all of which have implications for current water management efforts.
As Schaeffer acknowledged, “Landsat is unique in that it can go back to the 1980s at high spatial resolution.”
In the HAB early warning and prediction puzzle, Landsat is a valuable piece.
Locating Harmful Algal Blooms with Landsat
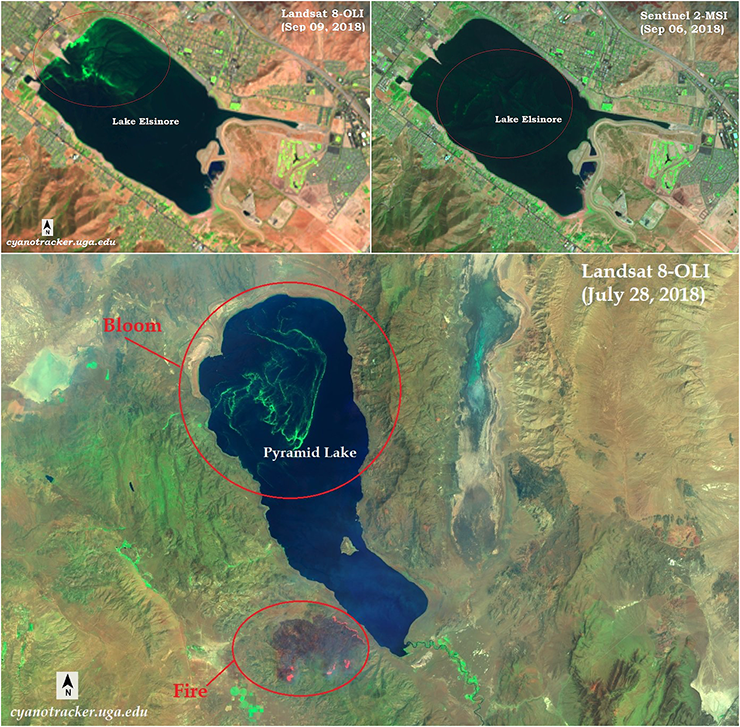
Cyanotracker is an early warning system developed at the University of Georgia that uses Landsat and the European Space Agency’s (ESA) Copernicus Sentinel-2 and Sentinel-3 data to provide near real-time monitoring of HABs in inland lakes, reservoirs, estuaries, and coastal lagoons around the world. It relies on a network of ground sensors and incident reports of HABs from social media, citizen scientists, and news reports to find HABs. Once a HAB is reported, Cyanotracker uses Landsat 8 data together with ESA’s Sentinel-2 and -3 data to map the spatial development of the bloom. These maps are widely distributed to water managers via social media.
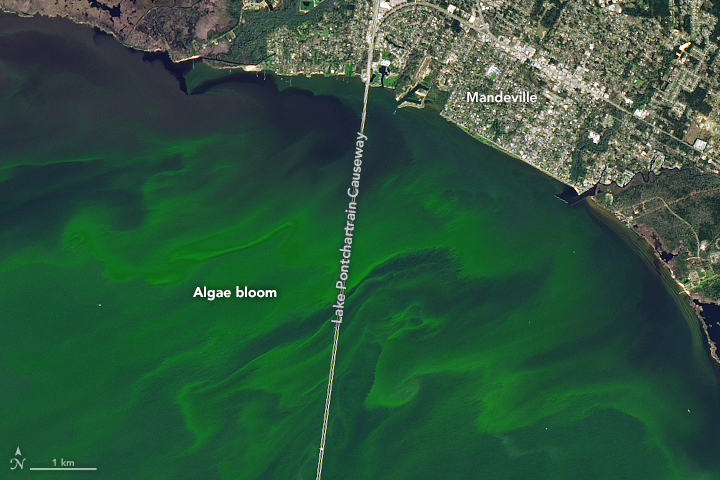
Cyanotracker was first to highlight an algal bloom in Lake Pontchartrain in March 2018 with Landsat 8 and Sentinel-2. It then used Sentinel-3’s Ocean Land Color Instrument (OLCI) to confirm the presence of cyanobacteria.
“We are successfully implementing a cross-calibration approached between Landsat 8 and Sentinel-2 to increase the temporal frequency much needed for HAB monitoring,” explained Dr. Deepak Mishra and Abhishek Kumar, Cyanotracker team members from the University of Georgia.
The Landsat 8 repeat coverage of a location is every 16 days, but together with the two satellites that comprise the Sentinel-2 mission (-2A and -2B) this frequency increases to 3-4 days and with the launch of Landsat 9 in late 2020, this will increase to every 1-2 days.
“The ultimate societal benefit of the Cyanotracker warning system,” said Mishra and Kumar, “is to enable early detection and timely implementation of preemptive measures to reduce the frequency and severity of future HAB events while ensuring environmental conservation and sustainability.”
UNESCO’s International Hydrological Program has created a World Water Quality Portal which aims to inform science-based decision making for water managers of UN member states. The portal, developed by EOMAP Germany, is currently using Landsat 8 and Sentinel-2 data to provide key indicators of water quality—turbidity, chlorophyll-a, Harmful Algal Blooms, organic absorption and surface temperature—for seven demonstration sites around the world.
At NASA’s Goddard Space Flight Center, a project directed by Landsat Science Team member Dr. Nima Pahlevan is developing a satellite-based near real-time water quality monitoring tool supported by existing field monitoring equipment that will alert water managers to potentially hazardous water quality conditions. These warnings will come with confidence levels that will help avoid false alerts.
“The radiometric quality and precision of Landsat 8 is really beneficial,” Pahlevan said, helping to detangle signal from noise. He added that the coastal/aerosol band on Landsat 8 (which will also be on Landsat 9) is very helpful when trying to measure dissolved organic matter in waters.
The Cyanobacteria Assessment Network, known as CyAN, is a multi-agency project. NASA, USGS, NOAA, and the EPA are working together to develop an early warning indicator system for algal blooms happening in freshwaters across the U.S. The project has developed a mobile app to provide immediate decision support to water managers. It currently uses Sentinel-3 data to map the presence of cyanobacteria and is testing the use of the Sentinel-2 satellite data as a tool for estimating total algae abundance.
As part of CyAN, Schaeffer and collaborators worked with USGS to determine if the USGS Landsat thermal product could be used to reliably map inland water temperatures. They found that it could.
This has two big implications for HAB monitoring. First, it allows scientists to look back in time to see when water temperatures triggered blooms and to see how environmental events like storms or droughts affected water temperatures. Secondly, it means Landsat water surface temperature information could be incorporated into future forecasting models.
“The Landsat temperature product would definitely be something that could be a staple in terms of the forecast models that would be built going forward,” Schaeffer said. “Temperature and nutrients are essential requirements when building the formulation of what drives these blooms.”
HAB forecasting is still an evolving science, but when water quality researchers talk with water managers about what they need, they all want the same thing: “Everybody is really interested in being able to forecast when and where cyanobacterial blooms will occur,” Schaeffer explained. “And that’s really hard right now, but we know that one of the main drivers is temperature.”
Better Together
CyAN, the World Water Quality Portal, and Cyanotracker—all of these projects are refining the HAB alert algorithms used to process satellite data into actionable information.
With the help of satellites like Landsat, HAB monitoring is happening across the globe. Satellite information is becoming a strategic asset for water managers protecting people from hazardous algal blooms, and upcoming missions like Landsat 9 and the NASA Plankton, Aerosol, Cloud, ocean Ecology (PACE) satellite will provide further information.
Meanwhile, HAB forecasting is on the horizon and satellites are poised to help. The use of satellite data, together with ground measurements, citizen scientist observations, and modeling is what will eventually make HAB forecasts possible. As Schaeffer said, “It’s when we figure out how to merge all that information together that we’ll get the big comprehensive picture.”
by Laura E.P. Rocchio, NASA Landsat Communication and Public Outreach
Related reading:
+ Tracking the Bad Guys: Toxic Algal Blooms, USGS
Further information:
+ Cyanotracker, University of Georgia
+ World Water Quality Portal, UNESCO’s International Hydrological Program
+ Cyanobacteria Assessment Network, EPA + NOAA + USGS + NASA
+ EPA Freshwater HAB Newsletter


