The Mechanics of Glacier Motion

The Mechanics of Glacier Motion

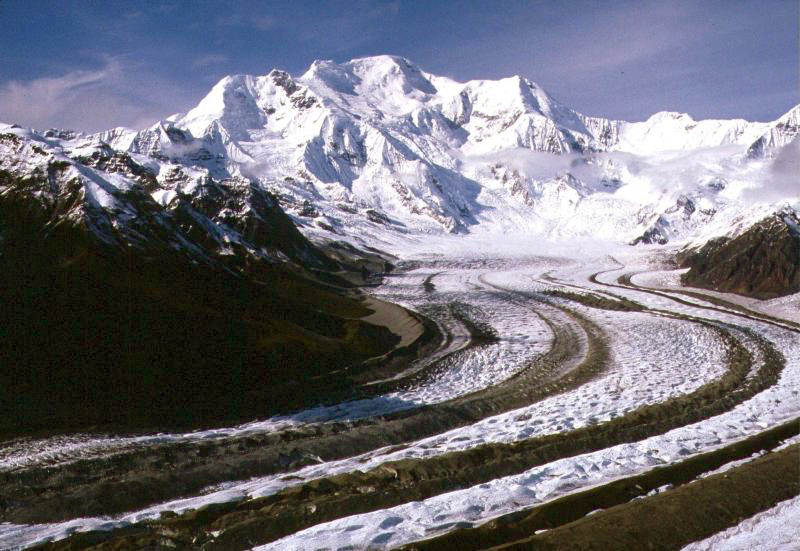
Nabesna Glacier
Nabesna Glacier & Mount Blackburn in Alaska. Photo
credit: Wrangell-St. Elias
William Armstrong is a glaciologist and PhD candidate at the Institute for Arctic and Alpine Research at the University of Colorado at Boulder. His research focuses on glacier velocity patterns in Alaska. Here’s what Mr. Armstrong shared with us about his research:
Presentation Title
Patterns of glacier basal motion across southcentral Alaska from cross-correlation of Landsat imagery
What are the major findings of this research?
We document patterns of glacier summer speedups associated with meltwater lubricating to the ice-bedrock interface. We find similar patterns from glacier-to-glacier, with 60-80% of the glacier length speeding up by ~10-20 cm/d. We find speedups generally cannot extend up-glacier up steep icefalls, which may indicate a change in glacier behavior at these locations.
What are the implications of your findings?
These findings help us understand the mechanics of glacier motion, which can help us better model and predict how glaciers will change, as well as how glaciers will erode alpine landscapes over geologic time.
What insight did you gain from Landsat that would have been impossible to glean otherwise?
We use Landsat 8 to document glacier velocity patterns on a mountain-range-wide scale. Mapping glacier velocity is facilitated by Landsat’s high radiometric resolution (i.e., how many shades of gray it contains along the spectrum from black to white) and precise geolocation (i.e., mapping of image pixels to a location on the earth’s surface).
What are the mechanics of glacier basal motion?
In summer, crevasses and moulins transport meltwater from the glacier surface down to its bed. At the bottom of the glacier, liquid water lubricates the ice-bed interface and facilitates glacier sliding like a puck on an air hockey table. Once the glacier becomes accustomed transporting large volumes of meltwater, water pressure at the bottom of the glacier decreases and the air-hockey effect ceases, causing the glacier to slow.
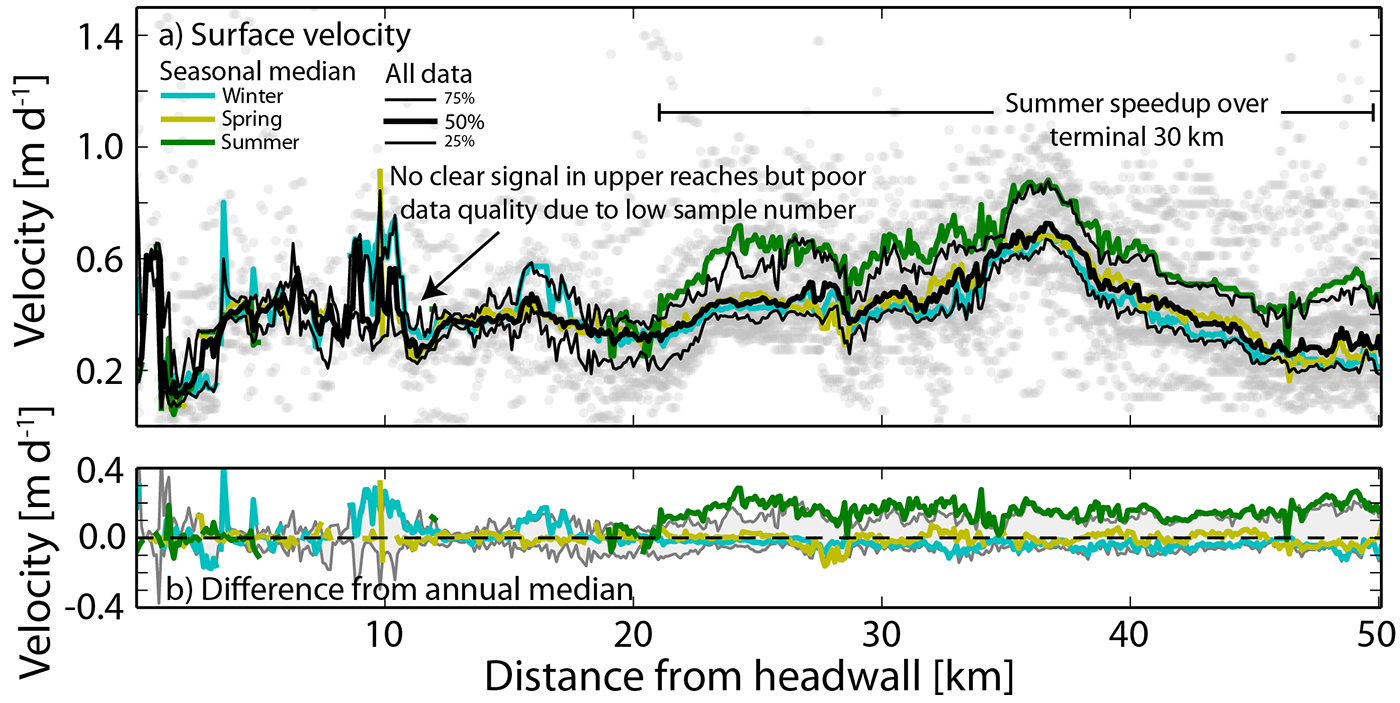
graph of glacier velocity
The top graph (a) shows seasonal velocity fluctuations along a down-glacier profile on Nabesna Glacier in Alaska. The green line shows the median summer speed, which is 10-20 cm/d faster than winter or spring speeds (blue and yellow lines, respectively). The lower graph (b) shows the down-glacier profile of seasonal velocity difference from the median velocity profile (heavy black line in panel (a). Image credit: Armstrong et al.

Co-authors:
Robert S Anderson
University of Colorado at Boulder
Mark A Fahnestock
University of Alaska Fairbanks
Allen Pope
National Snow and Ice Data Center
 
This research was made possible by NSF funding as well as funding from the Earth Lab initiative at the University of Colorado at Boulder.
 
 
Anyone can freely download Landsat data from the USGS EarthExplorer or LandsatLook.
Further Reading:
+ Landsat Abounds at #AGU16

Get the latest from Landsat in your inbox.


By submitting this form, you are consenting to receive marketing emails from: Landsat Science. You can revoke your consent to receive emails at any time by using the SafeUnsubscribe® link, found at the bottom of every email. Emails are serviced by Constant Contact
On Key

Recent Posts

Map shows South Korea with waterways highlighted. In the top right corner is a north arrow and in the bottom left corner is a legend of different rivers in South Korea.

Monitoring Water Quality in South Korea

South Korea is facing a water quality problem. Researchers Hyunglok Kim and Seongjun Lee from the Gwangju Institute of Science and Technology (GIST) embarked on developing a model to predict water quality indicators in near real-time.

Read More »
Landsat outreach specialist Allison Nussbaum and GEDI/UMD Faculty Specialist Talia Schwelling hold Landsat/GEDI postcards at the NASA exhibit booth at AGU24.

Landsat at AGU24

The NASA Landsat Science and Outreach teams attended the American Geophysical Union’s annual meeting in DC in December. At AGU24, they shared research and educated the public about Landsat.

Read More »
On Key

Related Posts

Map shows South Korea with waterways highlighted. In the top right corner is a north arrow and in the bottom left corner is a legend of different rivers in South Korea.

Monitoring Water Quality in South Korea

South Korea is facing a water quality problem. Researchers Hyunglok Kim and Seongjun Lee from the Gwangju Institute of Science and Technology (GIST) embarked on developing a model to predict water quality indicators in near real-time.

Read More »
Landsat outreach specialist Allison Nussbaum and GEDI/UMD Faculty Specialist Talia Schwelling hold Landsat/GEDI postcards at the NASA exhibit booth at AGU24.

Landsat at AGU24

The NASA Landsat Science and Outreach teams attended the American Geophysical Union’s annual meeting in DC in December. At AGU24, they shared research and educated the public about Landsat.

Read More »