
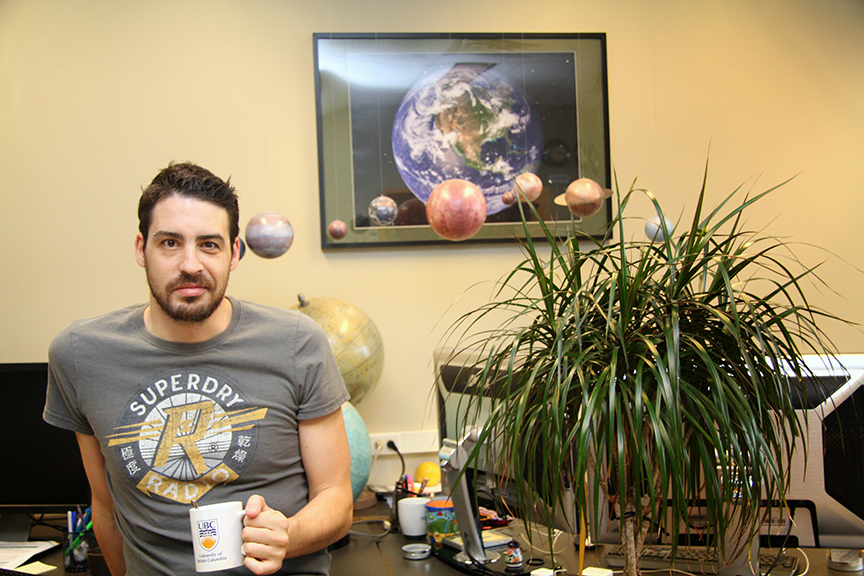
We spoke with one of the project leads, Txomin Hermosilla from the University of British Columbia’s Integrated Remote Sensing Studio, Department of Forest Resources Management, about the project:
Why is it important to know the history of Canada’s forests?
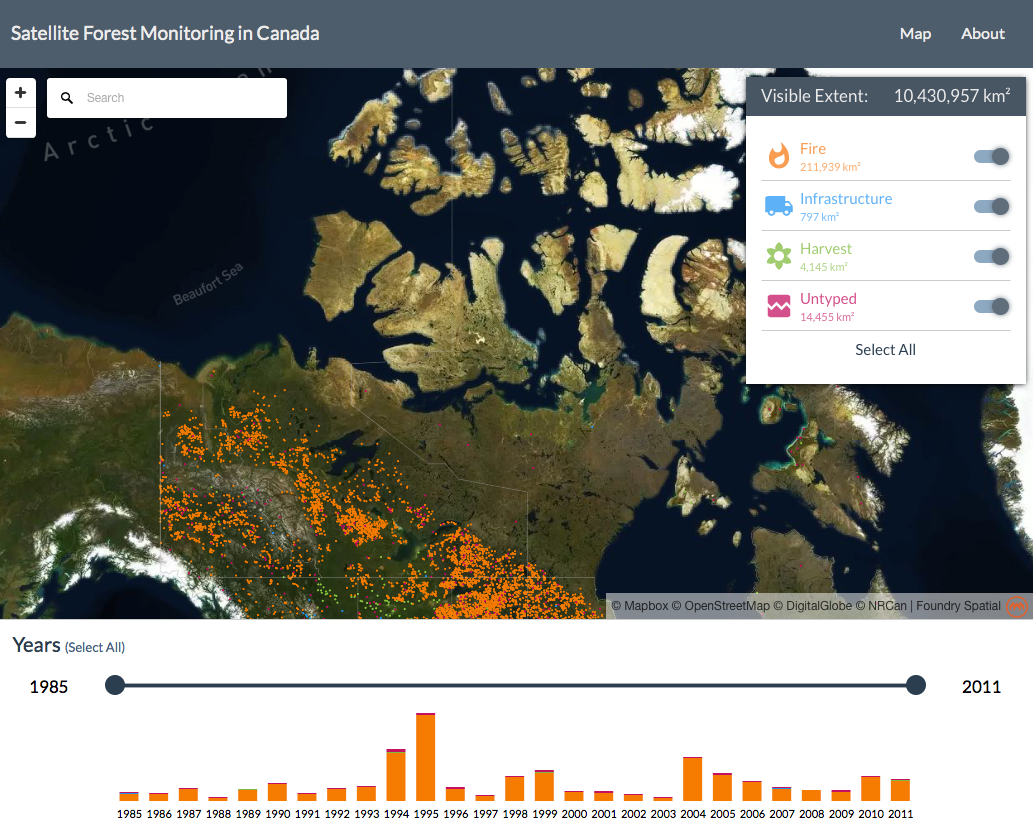
Having detailed information on historic trends in both forest disturbance and regrowth is important to establish a baseline to better understand the current and future forest changes and dynamics. In the current context of changing climate we need to understand the effects on the frequency and intensity of disturbances, and on rates and efficiency of regrowth. In this project we produced Canada-wide annual Landsat surface reflectance image composites and forest change events, characteristics, and types with 30-m spatial resolution from 1985 to 2011.
Can you provide some examples of people or organizations that would find this information helpful and how they might use the information?
The data set produced represents a single, nationally consistent, and verifiable source of information. It is currently being used by Canada’s National Forest Inventory and the Carbon Accounting Team in the Canadian Forest Service, and will it be available for Provincial and Territorial governments. Moreover, these data are the first nationally spatially-explicit records for forest harvesting in Canada
Why did you decide to create an interactive, publicly available map with your data results?
Foundry Spatial allowed us to develop and test a public explore-and-discover web tool for those users with non-proprietary software to easily access and visualize the last three decades of forest change in Canada. The web tool provides an overall view of the whole country, and also enables the user to zoom in to different change events, derive annual statistics by change type, and see their spatial context using underlying imagery.
What is Foundry Spatial?
Foundry Spatial comprises an expert team of scientists, programmers, and designers located in Victoria (BC). This team designs tools to develop comprehensive and clear maps that pinpoint environmental features, data visualization, and environmental analytics.
Why did you decide to host your interactive maps on their site?
Processing Landsat imagery for all of Canada, we produced 25 TB of annual image surface reflectance composites and related forest change products. Such large data sets are very challenging to share and manipulate. To overcome these limitations and to allow for public viewing, Foundry Spatial designed this web tool where users can rapidly visualize over 700 million points representing the forest dynamics occurring over the forested-area of Canada at 30-m spatial resolution from 1985 to 2011.
Reference:


