
Presentation Title
Differentiating surface water change from seasonal and inter-annual variability in North Western Canada using multi-decadal time series of data
What are the major findings of this research?
High density of Landsat observations in northern Canada enable the generation of a nominal annual surface water extent. Given the highly variable nature of surface water extent in the region we demonstrate the need for using the full time series to distinguish actual trend of change from natural inter-annual variability.
What are the implications of your findings?
Using high performance computing and the full Landsat record it is now possible to generate continent-wide surface water extent on an annual basis. This provides a consistent data record from which metrics of change can be derived. Surface water change in the Arctic is linked to carbon flux with wetting and drying of soils and to energy flux through changes in surface albedo, as well as latent and sensible heat flux.
What insight did you gain from Landsat that would have been difficult to ascertain otherwise?
Water bodies in the Arctic tundra tend to be small (< 1 hectare) which is too small to detect reliably with other instruments such as MODIS or VIIRS which have more frequent repeat coverage. The 30 m spatial resolution of Landsat is ideal for quantifying the water bodies but temporal density of measurements is usually a problem given Landsat's 16-day repeat cycle. In the northern latitudes this is overcome by the high degree of overlap in the Landsat swaths at high latitudes.
Why are some tundra water bodies increasing in size while others are decreasing?
This is an open question that we are currently still exploring. The difficulty is finding additional information to relate the surface water change to—there are only four weather stations in or near my study region and those don’t all have complete data records. Ongoing work is being performed to relate surface water change to potential ecological drivers. This work is expected to be published in early 2018.
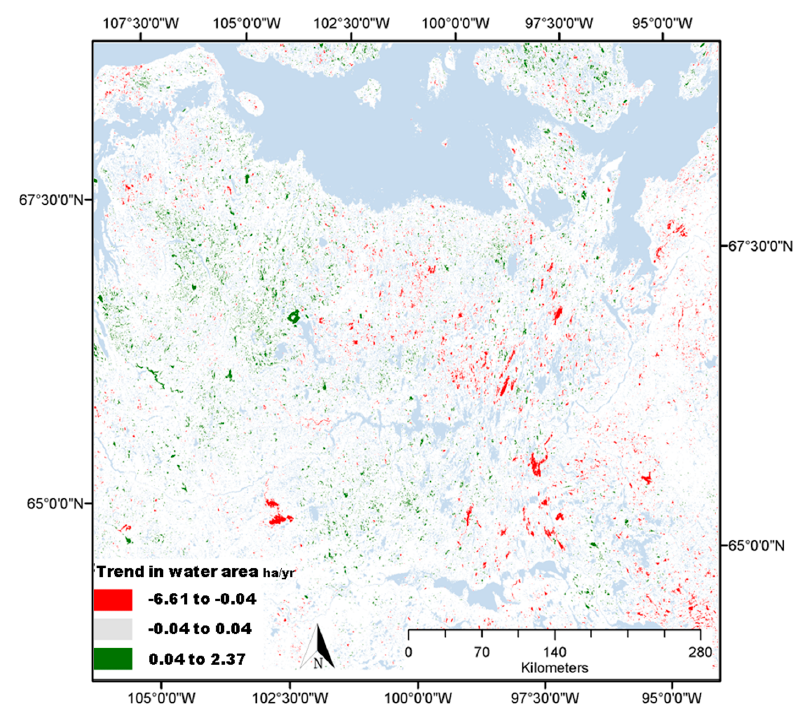 Spatial distribution of water bodies with a significant (p < 0.05) trend in surface water area (ha/year) over the 31-year time period of the study. Water bodies that are increasing in size are shown in green while the ones that are decreasing in size are shown in red. Image credit: Carroll and Loboda, 2017[/caption]
Co-authors:
Spatial distribution of water bodies with a significant (p < 0.05) trend in surface water area (ha/year) over the 31-year time period of the study. Water bodies that are increasing in size are shown in green while the ones that are decreasing in size are shown in red. Image credit: Carroll and Loboda, 2017[/caption]
Co-authors:
Mark Carroll
NASA Goddard Space Flight Center
Tatiana V Loboda
University of Maryland
This work was funded, in part, by NASA programs including Terrestrial Ecology and MEaSURES.
Anyone can freely download Landsat data from the USGS EarthExplorer or LandsatLook.
Further Reading:
+ Landsat at #AGU17

Be Part of What’s Next: Emerging Applications of Landsat at AGU24
Anyone making innovative use of Landsat data to meet societal needs today and during coming decades is encouraged to submit and abstract for the upcoming “Emerging Science Applications of Landsat” session at AGU24.


