
Dr. Gabriel Senay is a Research Physical Scientist with USGS EROS, North Central Climate Science Center. This afternoon at #AGU17, Dr. Senay is presenting a poster showing 31 years of observed water use trends in the Southwestern U.S. Here’s what Dr. Senay shared with us about his research:
Presentation Title
Using Landsat-based evapotranspiration data to assess the linkages between water right transfers and economic transactions in southern California
What are the major findings of this research?
The major findings are threefold:
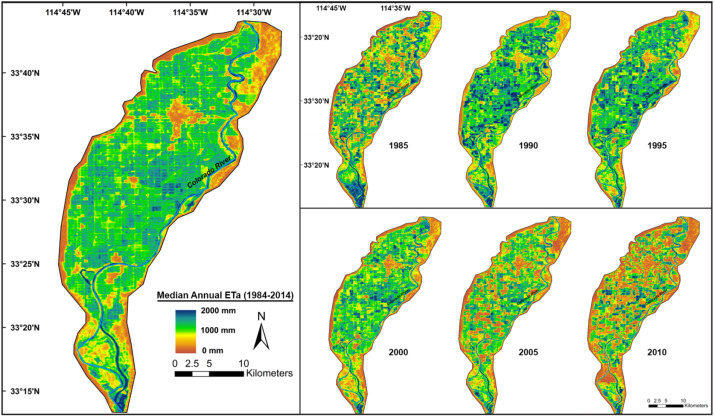
Historical Landsat data has been instrumental in assessing and demonstrating the impact of water right transfer from farmers to municipalities by way of reduced agricultural water use. This was quantified through a reduction in evapotranspiration (ET) which was inferred from the increasing land surface temperature as observed from Landsat thermal imagery.
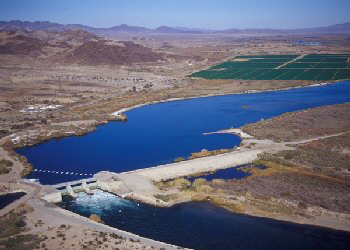
The connection between farmers in the Palo Verde Irrigation District (PVID) and city dwellers in the Los Angeles area can be summarized by the fact that an acre of farmland that is out of production will support about 8 families’ (~22 people) domestic water needs for a year.
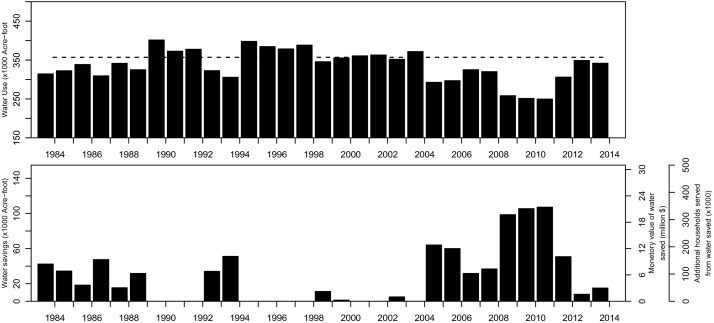
The study estimated that Palo Verde farmers saved water by not irrigating, with a monetary value close to $20.5 million at the peak of the fallowing year in 2011.
What are the implications of your findings?
Landsat can be used to monitor water rights and the implementation of water/land management decisions like crop fallowing programs.
With knowledge of average household sizes, Landsat-based ET modeling can be used to estimate volumetric water savings and transfers from agricultural to domestic water uses.
What insight did you gain from Landsat that would have been difficult to ascertain otherwise?
Only Landsat has the appropriate spatial resolution to quantify field scale crop water use.
Trend analysis of water use can only be studied using Landsat’s rich historical archive as shown in this study.
Do you have plans to extend your analysis past 2014? If so, will you be using Landsat data?
Yes, efforts are underway to map historical water use to the most current imagery for the conterminous US and beyond using a cloud computing environment.
Co-authors:
Gabriel B Senay
U.S. Geological Survey Earth Resources Observation and Science Center
Naga Manohar Velpuri
InuTeq LLC.
Matthew Schauer
MacKenzie Friedrichs
SGT Inc., Contractor to the USGS EROS Center
Ramesh K Singh
ASRC Federal
This work was performed by U.S. Geological Survey (USGS) Earth Resources Observation and Science (EROS) center in support of the USGS Land Change Science projects such as Landsat Water Balance and WaterSMART.
Anyone can freely download Landsat data from the USGS EarthExplorer or LandsatLook.
Further Reading:
+ Landsat at #AGU17
+ Watching Water Use in the Southwest


