By Laura E.P. Rocchio
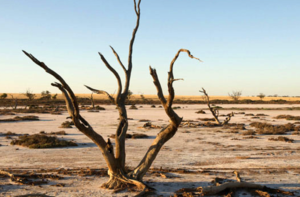
Since record keeping began in 1860, no period has been drier for southeastern Australia than the decade-long Millennium Drought. The lack of rain between 1997 and 2009 led to livestock losses, crop failures, and percentage drops in the Australian GDP.
But that’s not all. In Adelaide, municipal drinking water became some of the world’s saltiest and water use had to be restricted to indoor use only for many of the region’s urban areas. There were dust storms and bushfires. And then there was the ecological fallout.
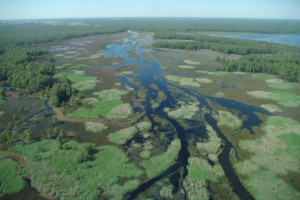
South of Adelaide, the Coorong Lagoon, a famous waterfowl sanctuary, was cut off from its main fresh water source for three long years; this turned half of it into a lifeless dead sea (with salinity levels matching those of the Dead Sea). The nearby Goolwa wetlands dried out, then acidified. The Barmah-Millewa Forest, an internationally recognized wetland famous for its River Red Gum trees, lost many of its iconic denizens. And inland, the Darling River set a world record for a 1000-kilometer long toxic algal bloom fed by undiluted nutrients from upstream farms.
Drought Impacts, Drought Action
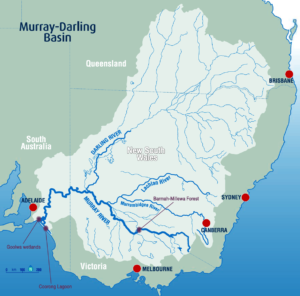
The impacts of the Millennium Drought were so severe that the Australian government created a federal agency whose job it is to balance the competing water needs of the region’s Murray-Darling Basin: agricultural, industrial, municipal, and environmental.
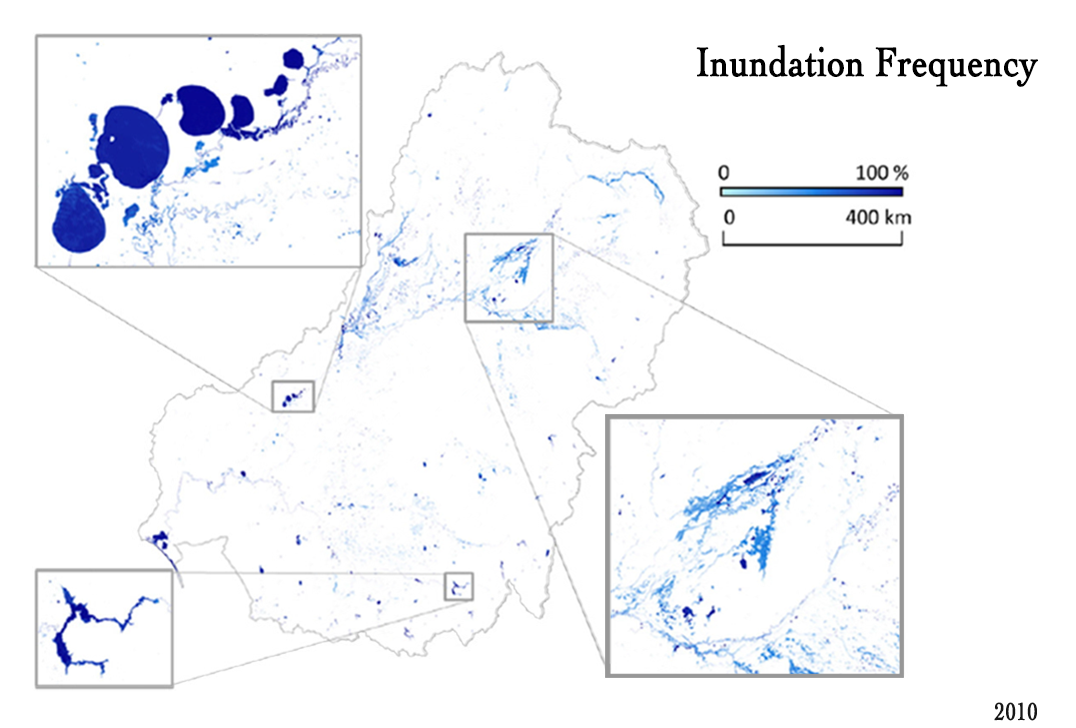
The federal agency, called the Murray-Darling Basin Authority or MDBA, has the difficult task of managing water for Australia’s agricultural heartland (which produces a third of the nation’s food) in a semi-arid region prone to boom-and-bust water fortunes. (Heavy rains and severe flooding from the 2010-11 La Niña event ended the Millennium Drought.)
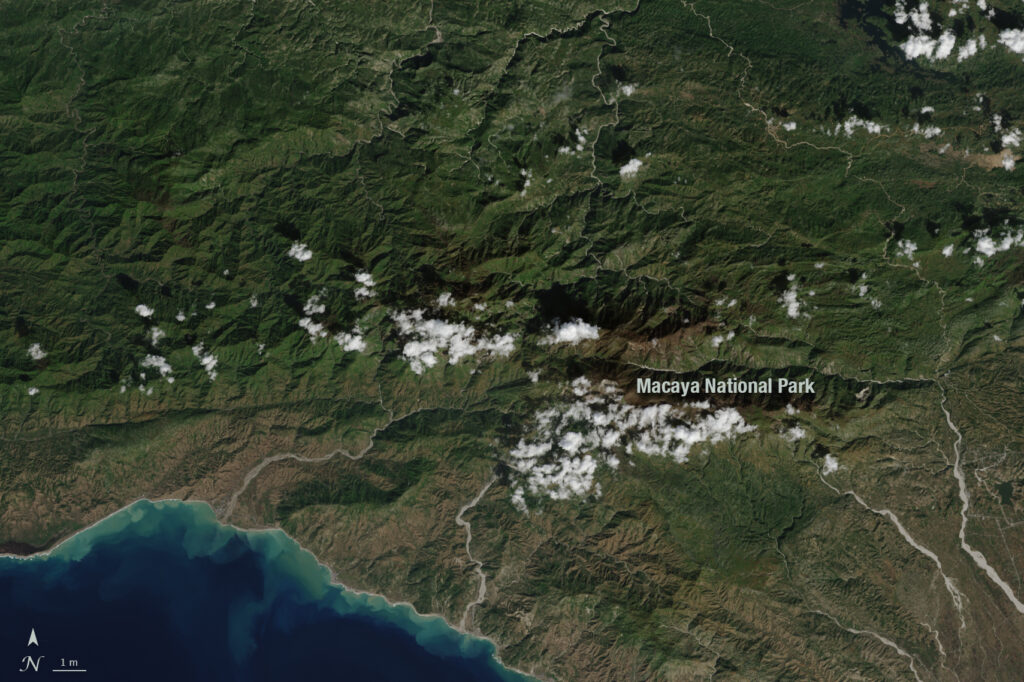
The basin is also home to some 30,000 wetlands—200 of which are deemed important Australian wetlands, and 16 of which are recognized internationally for their ecological importance. With so many competing demands for water, managers need to understand the basin’s historical water behavior in order to make astute water allocation decisions.
Taking It All In with a Bird’s-Eye View
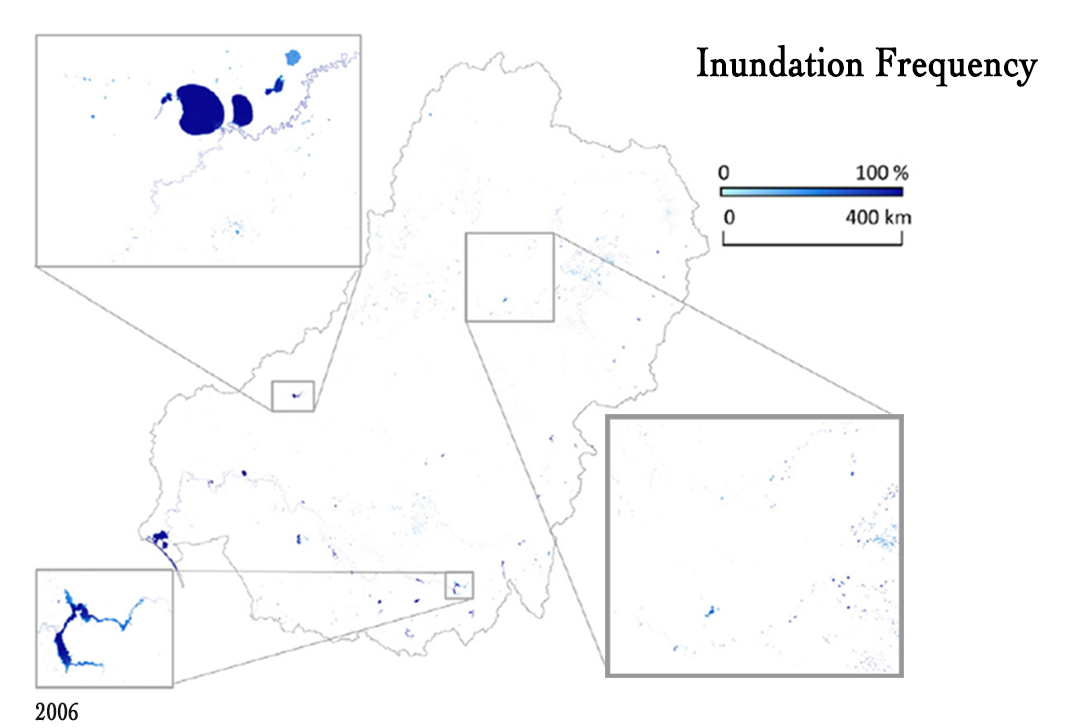
A team of researchers at the Geospatial Analysis for Environmental Change Lab headed by Mirela Tulbure of the University of New South Wales, used over a quarter-century of Landsat data to map the basin’s dramatically changing expanse of surface water from 1986-2011. The result of their work was recently published in Remote Sensing of Environment.
For the first time, thanks to Tulbure’s team, water managers have a series of maps that show how the Millennium Drought and following La Niña deluges impacted surface water throughout the Murray-Darling Basin.
Tulbure and colleagues processed more than 25,000 Landsat images to create their highly accurate, automatically generated Surface Water Dynamic (SWD) data set that provides a comprehensive historical record of the basin’s surface water between 1986 and 2011.
To look back in time to the mid-1980s and map water at a scale where small rivers could be seen, Tulbure turned to Landsat.
“For our main aim of quantifying surface water extent dynamics during a period of high hydro-climatic variability, Landsat was the only satellite archive to meet all our criteria,” she said.
Investing in Water
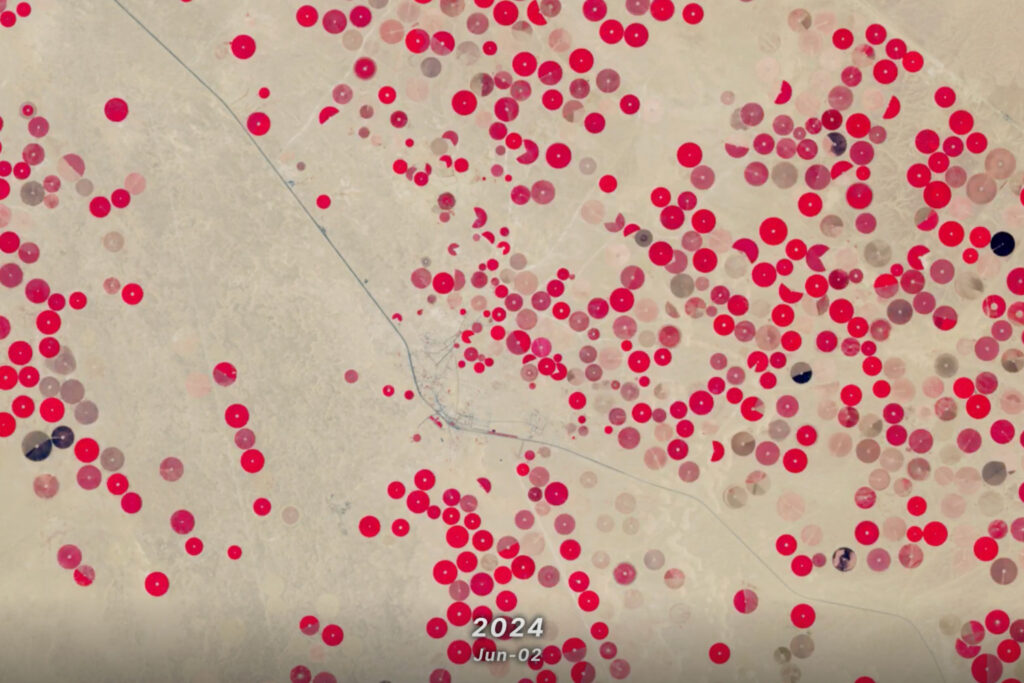
Extensive irrigation works were introduced to the Murray-Darling Basin (MDB) starting in the 1950s as agricultural production intensified. By the time the Millennium Drought hit, agricultural lands had grown to cover some 80 percent of the basin and use up the same percentage of its average annual surface water (11.3 cubic kilometers/year).
Irrigation had caused the estimated 12.2 billion liters of water that once made its way through the basin and into the sea to dwindle by two-thirds by the time the MDBA was formed. The natural floodplain flooding that nourished local wetlands had been severely reduced by the highly managed irrigation system—to the detriment of the wetland ecosystems.
After the Millennium Drought brought these issues to a head, the Australian Government made a $10 billion investment in environmental water allocation (including buying back some water rights from farmers to increase environmental water flows, mimicking natural flows to maintain ecological health).
Supporting Water Policy Decisions
“To be able to quantify where the water is, there needs to be a systematic quantification of surface water dynamics, which is only possible from satellite data in an automatic manner—this is why our product is important to water and land managers,” explained Mark Broich, a co-author of the study from the University of New South Wales. (Satellite measurements of surface water extent dynamics, were recently named a top ten indicator required for monitoring global biodiversity targets.)
“The MDB is one of the driest basins in the world,” Tulbure pointed out. The SWD data set provides baseline information to support water policy decisions in the water scarce MDB.
To test the reliability of their data set, Tulbure’s team used a rigorous accuracy assessment to validate their surface water measurements. The assessment confirmed that their SWD product was highly accurate for all years, wet and dry.
“Providing an unbiased estimate of the accuracy of our SWD product and quantifying the uncertainty of the estimate are paramount for follow-on applications,” Broich said.
Using the SWD data set, regional water managers can now see how vegetation responds to flooding, how ephemeral wetlands are connected during wet periods, and what the major drivers of surface water change are. With this knowledge important questions can be answered:
- How long does it take the River Red Gums to respond to rejuvenating floods?
- What wetland stepping-stones are available to native frogs in this hotspot of amphibian decline?
- Year-to-year, what matters more for water availability—river flow or rainfall?
- Where are there perennial wetlands?
Once these questions are answered, wise water allocations can be made.
Dress Rehearsal for a Dry Century
Of inhabited continents, Australia is the driest. Its water resources are scarce. And climate change isn’t helping. The Austral summers of 2012/3 and 2013/4 broke heat record after heat record, earning them the moniker of “Angry Summers.”
In the future, drier and warmer conditions are expected for southeastern Australia. The SWD data set lets water managers evaluate what happened to surface waters during the Millennium Drought—that dry decade that may have been just a dress rehearsal for the dry century to come.
Further Reading
+ Coorong recovery begins, but still room for improvement, The Conversation
+ Environmental science: Agree on biodiversity metrics to track from space, Nature
+ The Angry Summer, Climate Council
+ Dramatic responses to extreme climate phases, OzEWEX
+ New paper on mapping surface water and flooding extent dynamics over MDB using three decades of time series satellite data
Reference: