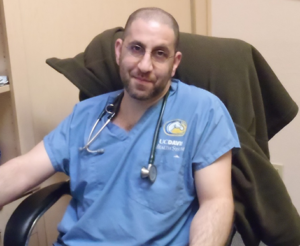
But first, a little about Todd.
Todd has a degree in electrical engineering and for a while he was developing scientific and medical devices. But in 1997 he decided he wanted to study veterinary medicine, so he made his way out to California and eventually earned both a doctorate in veterinary medicine (2008) and a master’s in preventive veterinary medicine (2009) from U.C. Davis.
An old friend at U.C. Davis, Maurice Pitesky, was working on Avian Influenza risk mapping in California and invited Todd to collaborate on his project.
In the course of this work, Todd was introduced to U.S. Geological Survey collaborator Elliott Matchett, who told him that Landsat was a good tool for assessing land cover. And now Todd uses Landsat to help inform his research.
Here are the questions we put to Todd:
Can you describe your project and explain what problem are you trying to solve with your research?
Our group in the School of Veterinary Medicine at the University of California, Davis is creating a real-time risk map for the transmission of Avian Influenza (AI) to susceptible animal populations within the state of California, primarily commercial and backyard poultry.
Current surveillance efforts for AI in the species thought to harbor the virus (wild waterfowl) either rely on passive surveillance or on models that are averaged over several years of location data. By developing a spatiotemporal risk map, we hope to provide a mechanism by which to guide surveillance efforts for AI within California and beyond.
Why does this matter to the public?
Not only does AI potentially lead to devastating levels of bird mortality (once infected, entire flocks must be depopulated to prevent spread of the disease—in the 2015 AI epidemic in the US, almost 50 million birds were killed) and huge economic losses (approx $3.3 billion during the same period), but AI is potentially zoonotic—there are strains of the virus that are transmissible to people and can cause illness.
Why is spatial and seasonal (spatiotemporal) information important to your project?
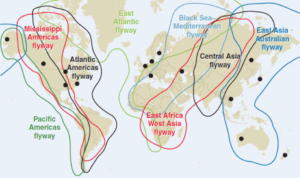
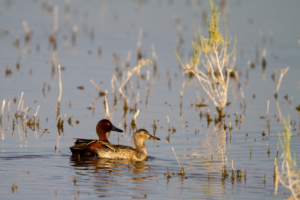
The carriers of the virus are primarily wild waterfowl—various migrant species of dabbling ducks, like Northern Pintails—that spend the warm months up in Canada and the Arctic, then migrate south through the US (and beyond) for overwintering.
Understanding where those populations are likely to be found is key to predicting which commercial or backyard operations may be at higher risk of transmission for AI, and where surveillance efforts should be concentrated.
What are the main benefits of incorporating Landsat into your research?
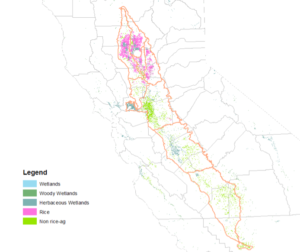
Landsat allows us to identify potential roosting and feeding sites of the wild waterfowl, which are primarily wetlands and agricultural fields (like rice) which provide forage for the birds.
Using past Landsat data, we can also analyze how these areas have changed over time—especially important in drought-ridden California. This allows us to create predictive models of waterfowl density across the state, which we believe correlates with risk of transmission.
What do you see as the final outcome of your research? And how could it potentially be used operationally to help limit the spread of Avian Influenza?
The end product will be a real-time risk map that multiple parties (government agencies, commercial and backyard producers) are able to access 24×7 through a web interface or mobile app.
For government agencies tasked with AI surveillance, this could be used to target waterfowl populations for testing. Commercial producers at increased risk may choose to increase biosecurity efforts. Backyard producers may be more vigilant about keeping their flocks in their coops and observing for wild waterfowl in the area.
What are your thoughts on Landsat in general?
I’m fascinated by the history of the various Landsat missions and the technology behind each—I still can’t believe all this wonderful data is freely available! Let’s hear it for #openscience!
Related reading
+ Landsat Helps Feed Tired And Hungry Birds