Search
Close this search box.

Meat of the Matter:
Colorado River Over-Consumed

Meat of the Matter:
Colorado River Over-Consumed

By Laura E.P. Rocchio

The Colorado River has an accounting problem. More water is taken from the river than it has to give.

The dwindling state of the river has recently prompted mandatory water cutbacks, and the realization that if the amount of water withdrawn is to be brought into balance with the water that’s available, a more detailed and granular understanding of how the Colorado is being consumed is needed.

Pie chart of consumptive Colorado River water use.
Research conducted by Richter et al., 2024 and aided by Landsat satellite data found that the Colorado River’s major consumptive uses from 2000-2019 were Agriculture (52%), evapotranspiration from natural vegetation (19%), municipal, commercial and industrial (18%), and evaporation from reservoirs (11%). Irrigation for cattle feed was the single largest consumptive use. Taking an estimated 32% of the Colorado River’s flow. Image based on data from Richter et al., 2024.

In a feat of data wrangling not before attempted, a comprehensive, crop-specific water budget has been created for the entire Colorado River Basin, from headwaters to delta.

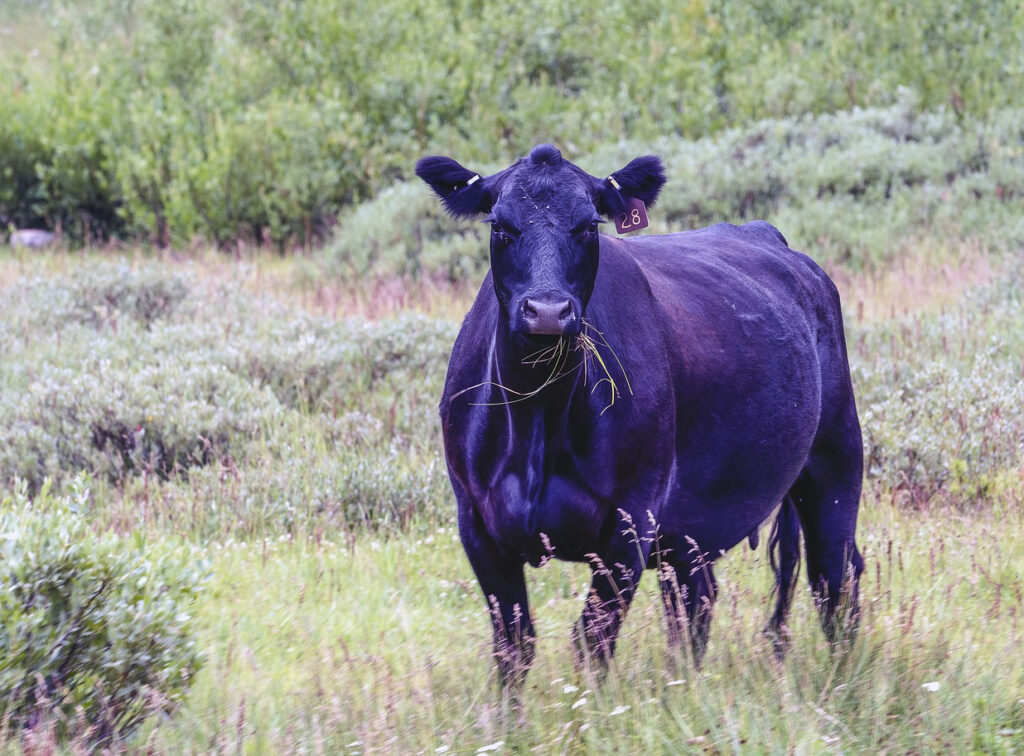
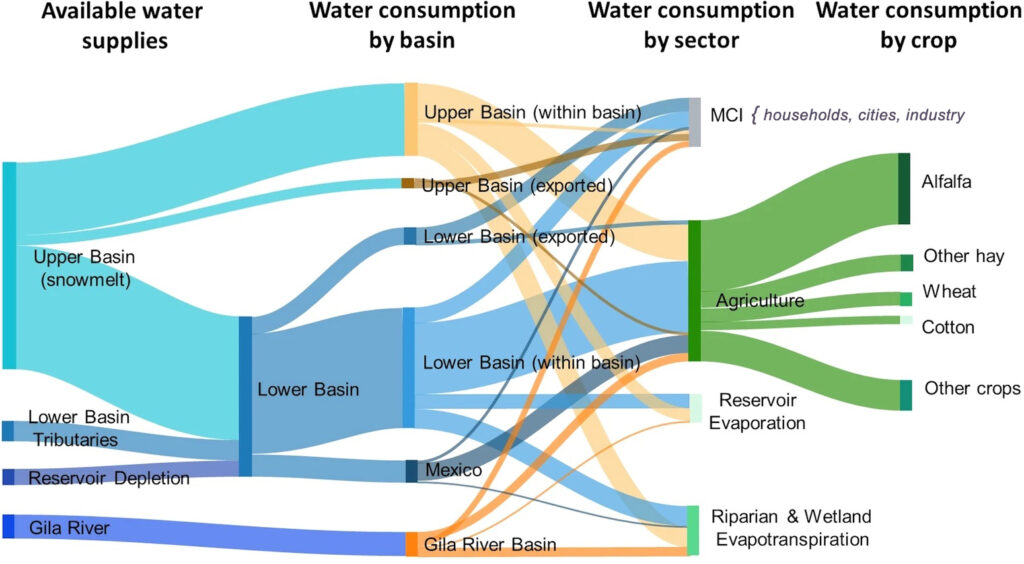
The results, recently published in Communications Earth & Environment, show that irrigation uses more than half of the river’s water, with alfalfa and other hay-like cattle-feed crops drinking up the lion’s share—nearly a third of the entire river’s flow. Natural vegetation along the river’s banks consumes about a fifth of the river’s water, evaporative loss from dams a tenth. Another fifth goes to households, cities, and industry.

This new, full accounting of average annual Colorado River water use—partially informed by Landsat satellite data—provides necessary clarity for hard future decisions.

A visual summary of the Colorado River supplies. A number of lines of different thickness and colors go from the left showing available water to the right showing water consumption by sector and crop.
A visual summary of the Colorado River Basin's water availability (left) and water consumption (right). Image credit: Richter et al., 2024

Tapped Out

Colorado river curves through the purple and red rocks of the Grand Canyon. Photo by Kendrick Callaway
The Colorado River as it meanders through the Grand Canyon. Photo credit: Kendrick Callaway

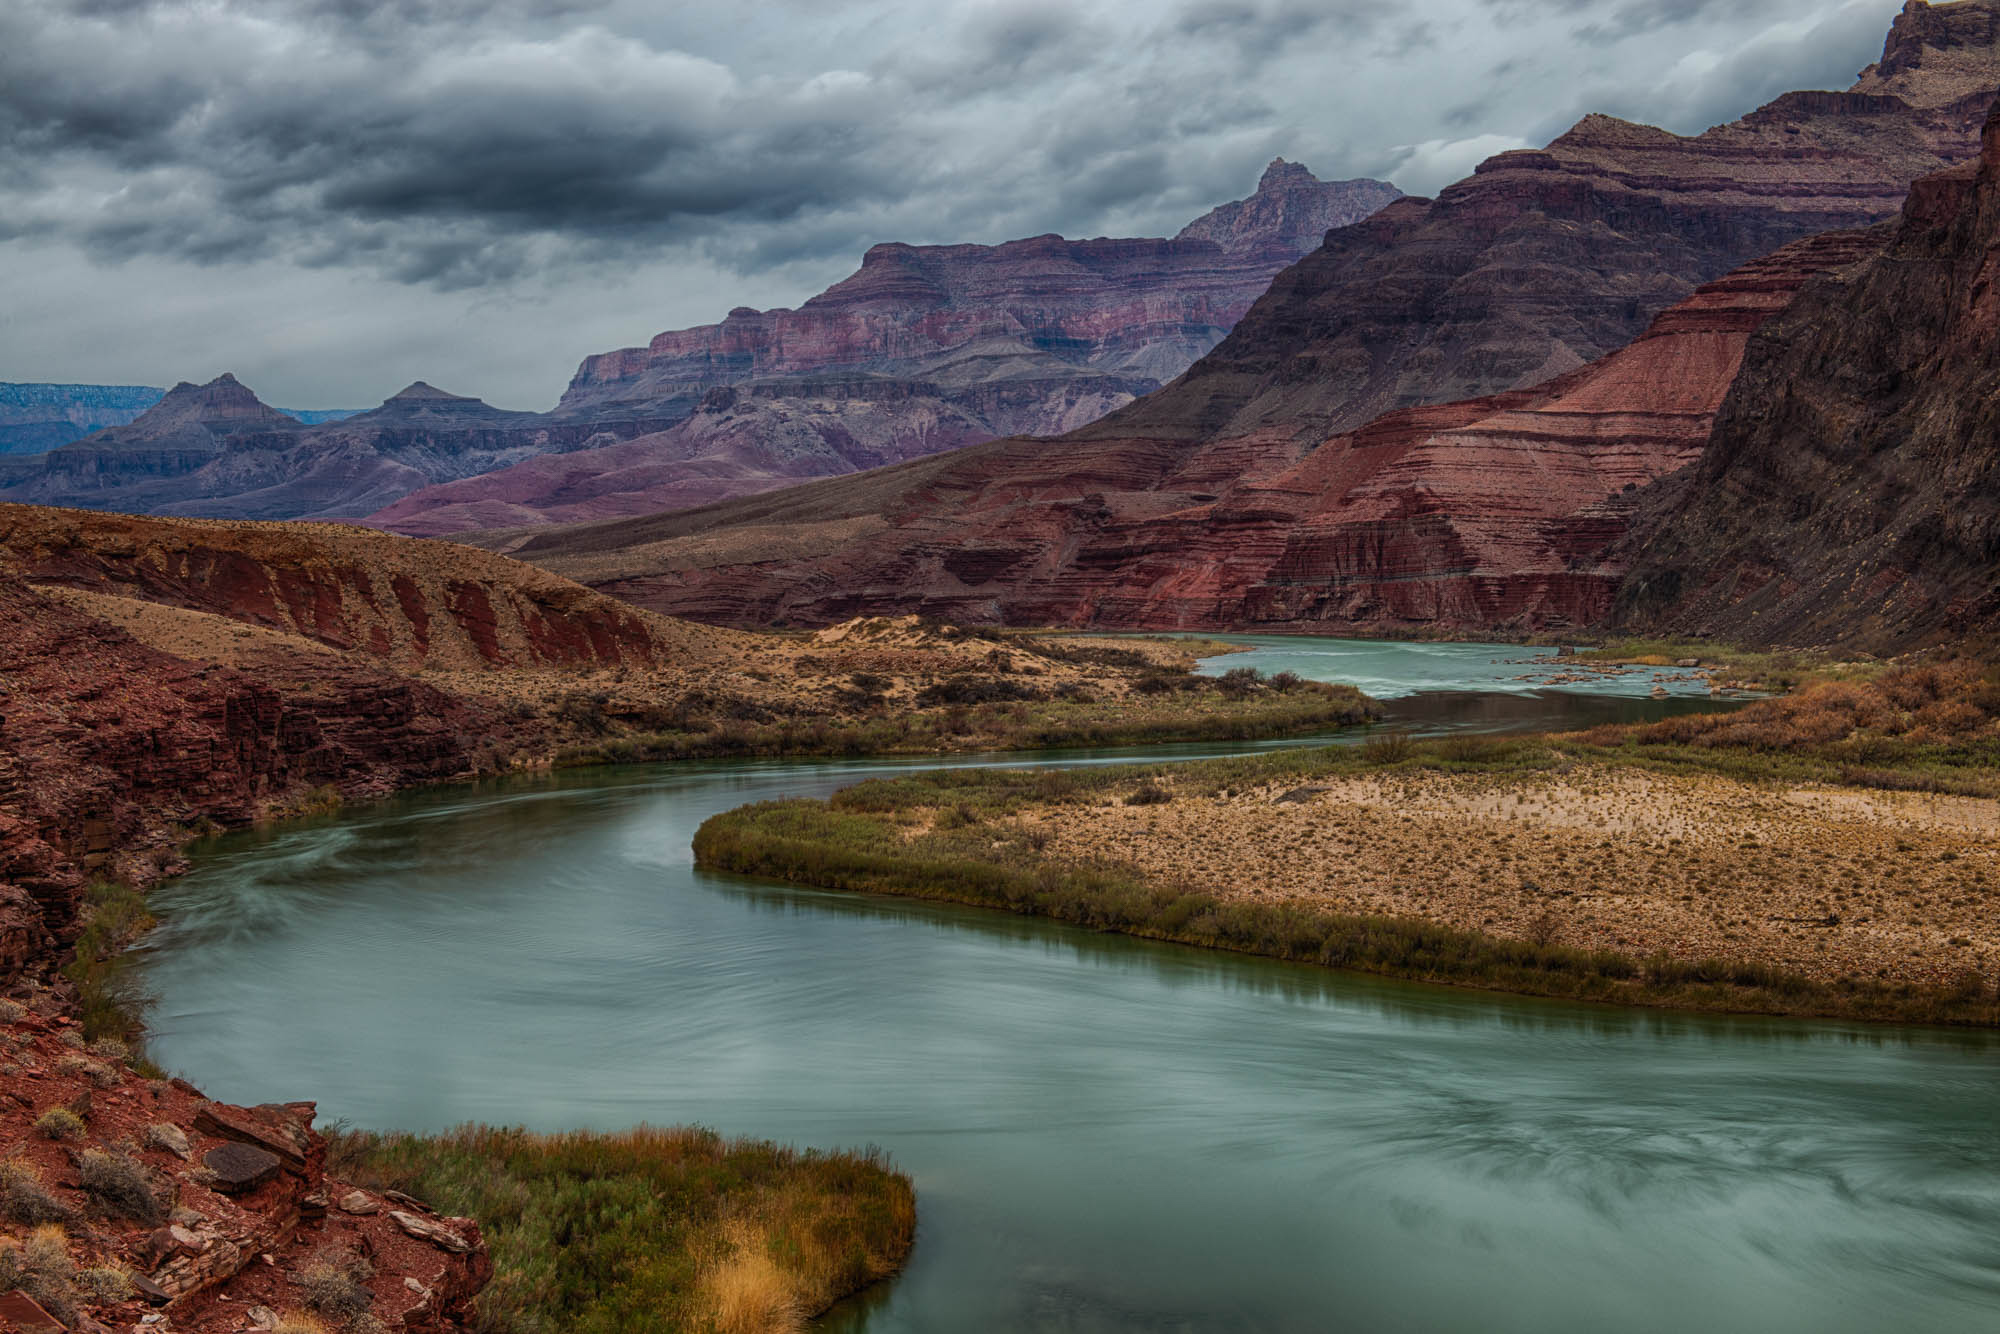
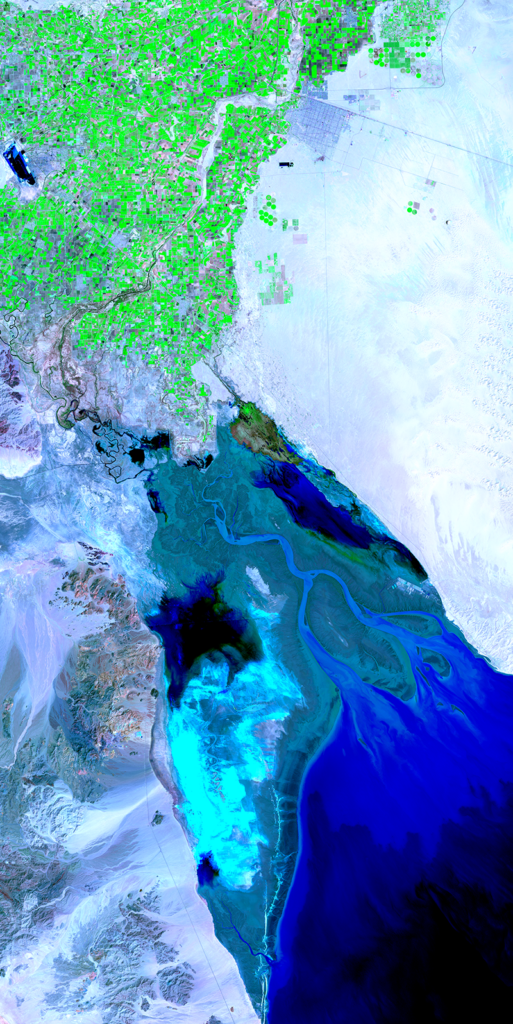
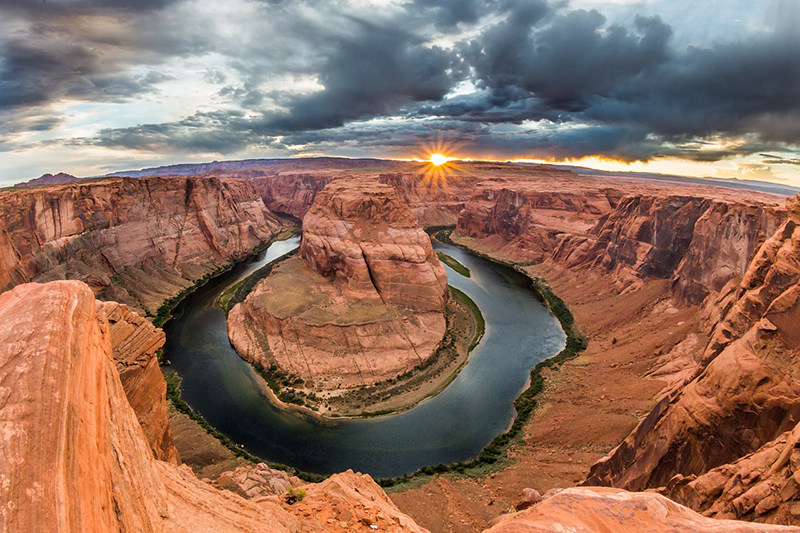
The mighty Colorado, the formidable sculptor of the Grand Canyon, no longer meets the sea at the river’s Mexican terminus: the long, narrow Gulf of California where a vast delta—likened to the Nile’s—once existed.

The river is fully consumed before getting there.

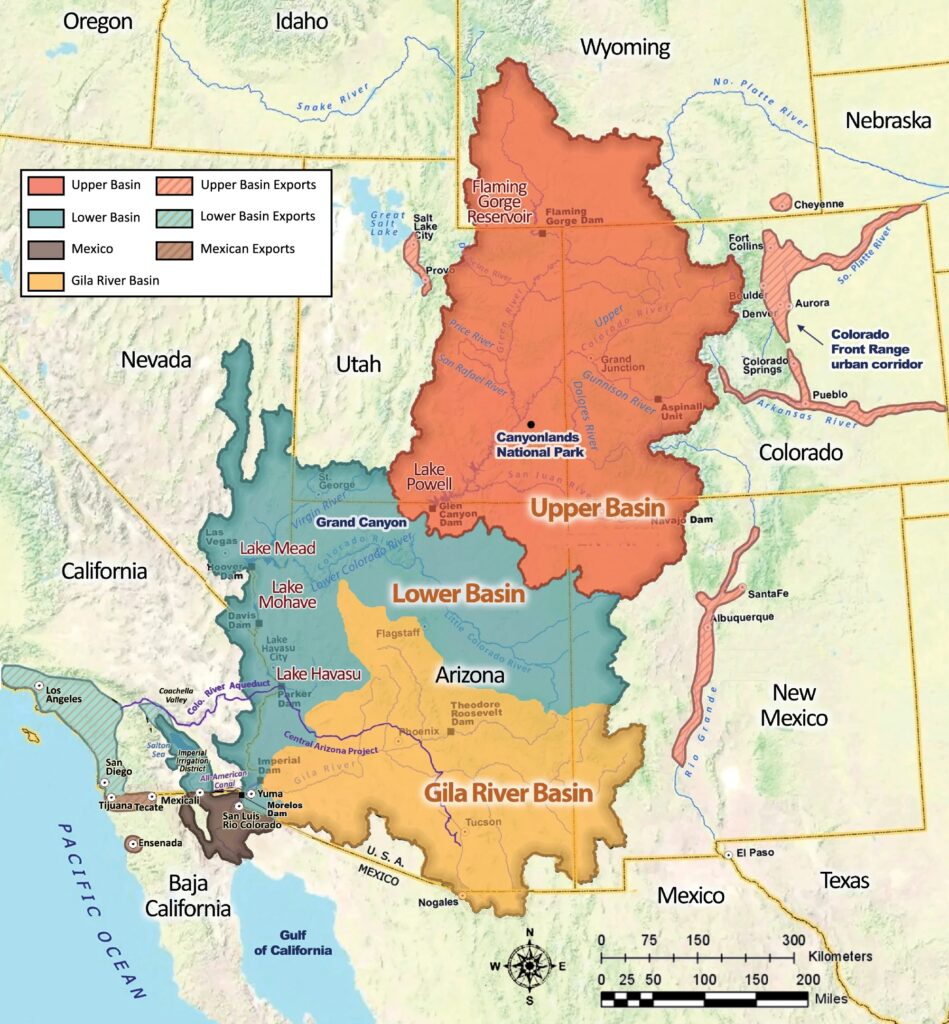
Consumed by over 5 million acres of cropland, where vegetables, fruit, grains, and a sizable swath of feed for dairy and beef cattle are grown. Piped and ported to support cities and farms across the American Southwest from Cheyenne to San Diego, meeting the water needs of 40 million people. Used by natural vegetation along its banks and lost to the atmosphere from evaporating reservoirs.

With colleagues, lead author Brian Richter, a Senior Freshwater Fellow at the World Wildlife Fund, estimated that 23.7 billion cubic meters (19.3 million acre-feet) of Colorado River Basin water was consumed each year on average during the 2000-2019 study timeframe—that’s one-and-a-half times more water than the amount stored in Lake Mead, the nation’s largest reservoir by volume, over the last two decades on average.

In May 2023, on the heels of a temporary Colorado River water use compromise, many New York Times readers were astonished to learn that the single biggest direct human use of Colorado River water was growing food for cows. In an era of mandatory water restrictions, shorter showers and more efficient washing machines, it gave many pause (omnivores especially), to learn that alfalfa and other cattle-feed crops was the single biggest guzzler of the proverbial Colorado cup. The story relied on Richter’s earlier 2020 water accounting.

A black cow stands in a green pasture eating grass.
A Utah cow grazes at pasture. Photo credit: Amy Spielmaker, Pixabay

The research published last month is a refinement of those first estimates—a more complete accounting that chases down the end use of water exported from the Colorado, it also includes water consumption in Mexico, and calculates both reservoir evaporation and the water used by riparian and wetland vegetation along the river.

The staggering water consumption of alfalfa and other cattle-feed crops shifted downwards only slightly with the new exhaustive accounting, still hovering around half of direct human use (dropping from 53% to 46%).

It’s well-known that crop irrigation is the largest water user worldwide. The Colorado River Basin is no different, crops consume three times more water than all other direct human uses combined (municipal, commercial and industrial).

However, Richter’s crop-specific water accounting—aided by Landsat—represents a significant advancement in water budgeting: knowing which crops are getting how much water. Richter found that in the upper reaches of the Colorado Basin, 9 out of every 10 drops of irrigated waters go to cattle-feed crops.

The work is also noteworthy for the calculation of a number that is tricky to assess without the help of Landsat: naturally occurring vegetation (riparian and wetland) consume 19% of the Colorado’s waters.

Mapped Out

As the Colorado River winds its way down from Rocky Mountain National Park through the U.S. Southwest and into Baja California it is fed by a network of streams and rivers. The geographic region where rain and snowmelt flow downhill into this network is the river’s watershed, known as the Colorado River Basin.

A full, crop-specific accounting of the Colorado River Basin including both direct and indirect water use has been elusive previously. This is due, partly, to the vagaries of time and tradition and partly, to the technical challenges of measuring crop-specific and indirect water use.

The U.S. Bureau of Reclamation operates the water infrastructure of the Colorado River and regularly provides river accounting.

A map of the Colorado River Basin showing the three major sub-basins and regions that receive water exported from the Colorado.
A map of the Colorado River Basin showing the three major sub-basins (Upper Basin, Lower Basin, and Gila River Basin) as well as the Mexican portion of the watershed and the areas that receive water exports fron the Colorado. Map credit: Richter et al., 2024

However, those numbers do not include water used in Mexico nor Arizona’s Gila River Basin, the latter of which makes up nearly a quarter of the Colorado’s watershed.

When the Colorado’s water rights were codified in the U.S. Colorado River Compact of 1922, bitter disputes over the Gila River (which often runs dry) made it easier to leave its basin out of the compact rather than find compromise. So, politics triumphed over geography in defining the Colorado River accounting practices that have been traditionally used—but water accounting for the Colorado River without tracking the water of its lower reaches is like calculating your body’s blood volume but disregarding your legs.

Richter’s work captures water use from both the Gila River Basin and Mexico, as well as the water exported outside of the basin via 47 different transfer systems (think canals, pumps, and pipelines).

Two of the other significant advances of Richter’s accounting were enabled by Landsat.

The essential and enlightening crop accounting done in the study relied on two Landsat-informed datasets from the U.S. Department of Agriculture called the Cropland Data Layer and the Landsat-based National Irrigation Data, or LANID.

“Without these datasets, we would not have been able to compute crop-specific volumetric water consumption for the region,” Richter commented.

Bright green irrigated fields appear above the blue and green of the Colorado River Delta.
A Landsat 9 image acquired on Apirl 13, 2024, showing what remains of the Colorado River Delta. Irrigated fields can be seen at the top of the image (north).

The Cropland Data Layer provides the crop-specific land cover information needed by the research team to spatially interpret county-level harvested area numbers, meanwhile, the LANID dataset lets the team know which crops used irrigation.

Landsat also helped make indirect (non-human) water use calculations possible. Natural habitats throughout the Colorado River basin have been stressed because of low river-flow, imperiling the ecological services they provide.

“In the estimation of riparian vegetation evapotranspiration, Landsat-informed data sets played a pivotal role,” Richter shared via email.

Using a recent Landsat-based map of riparian vegetation in the Colorado River Basin, known as CO-RIP, in tandem with the Landsat-based OpenET dataset, the research team was able to tease out the amount of water being consumed (via evapotranspiration) by natural vegetation.

“Determining the water losses in the Colorado River due to riparian vegetation would have posed an immense challenge without these two Landsat-informed records,” Richter explained.

Justin Huntington, a Desert Research Institute hydrologist and former Landsat Science Team member not associated with this research, commented that while the potential crop water use calculation method used in this study relies on modeled crop growth, there are new opportunities and ongoing studies by Reclamation that use field-scale Landsat products, such as OpenET data, to better represent actual water use conditions and account for shortage and drought impacts in the basin.

“Overall, the study is a nice example of how Landsat products can be used—and are necessary—for quantifying and summarizing water use volumes at spatial scales that are relevant for water resource studies in water-limited regions,” Huntington remarked.

Whiskey, Water, and Satellites

“Whisky is for drinking; water is for fighting.” This western witticism, often misattributed to Mark Twain, captures a stark reality—in the U.S. West, water is both scarce and essential. 

As a warming climate leaves less and less water in the Colorado River system, more pressure will be put on the stored waters of Lakes Mead and Powell. Already, the Colorado is being over consumed, straining those reservoirs.

The Colorado River curves through the red rocks of Glen Canyon National Recreation Area in Arizona.
The Colorado River curves through the red rocks of Glen Canyon National Recreation Area in northern Arizona creating Horseshoe Bend. Photo credit: Tobias Brunner, Pixabay

Just like your household budget, it’s not good to be using more than is being made. For the Colorado to survive, cutbacks and compromises are likely in its future.

Better water use accounting, aided by satellites like Landsat, is now here to provide needed guidance for the difficult decisions ahead.

Reference

Richter, B. D.; Lamsal, G.; Marston, L.; Dhakal, S.; Singh Sangha, L.; Rushforth, R. R.; Wei, D.; Ruddell, B. L.; Frankel Davis, K.; Hernandez-Cruz, A.; Sandoval-Solis, S.; Schmidt, J. C. New Water Accounting Reveals Why the Colorado River No Longer Reaches the SeaCommunications Earth & Environment 20245 (1). https://doi.org/10.1038/s43247-024-01291-0

Related Reading

Banner Image Caption: A Landsat 9 natural color image acquired on April 13, 2024 of the Colorado River and the U.S. /Mexico border.

On Key

Recent Posts

On Key

Related Posts