
“With the full Landsat record available, we can finally look at really big problems, like the global carbon cycle,” said Jeff Masek, the Landsat 7 project scientist and a researcher at NASA’s Goddard Space Flight Center. Because carbon dioxide gas amplifies greenhouse warming, understanding how it moves into and out of the atmosphere through the carbon cycle is central to understanding Earth’s climate.
Forests store carbon, and the Landsat series of satellites offers the most consistent, detailed, and global means to measure changes in forest health—both natural and human-caused (such as deforestation). But to get a sense of how much carbon is entering the atmosphere from forests, scientists have to figure out how to sort through petabytes of data.
“The scale of human development is getting finer,” says Randy Wynne, a geographer at Virginia Tech. “In Virginia, the average rural parcel size is under 70 acres, and it’s dropping. Some 85 percent of forests are privately owned in the eastern United States. If you want to see human influence in most of the world’s forests, you need this kind of analysis. Nothing else can get at it.”
It Takes a Village…of Computers
“The issue is scaling it up,” says Robert Kennedy, a remote sensing scientist at Boston University who developed the LandTrendr analysis tool. “Even if you have a simple algorithm, you need a lot of computing to manage all of the data.”
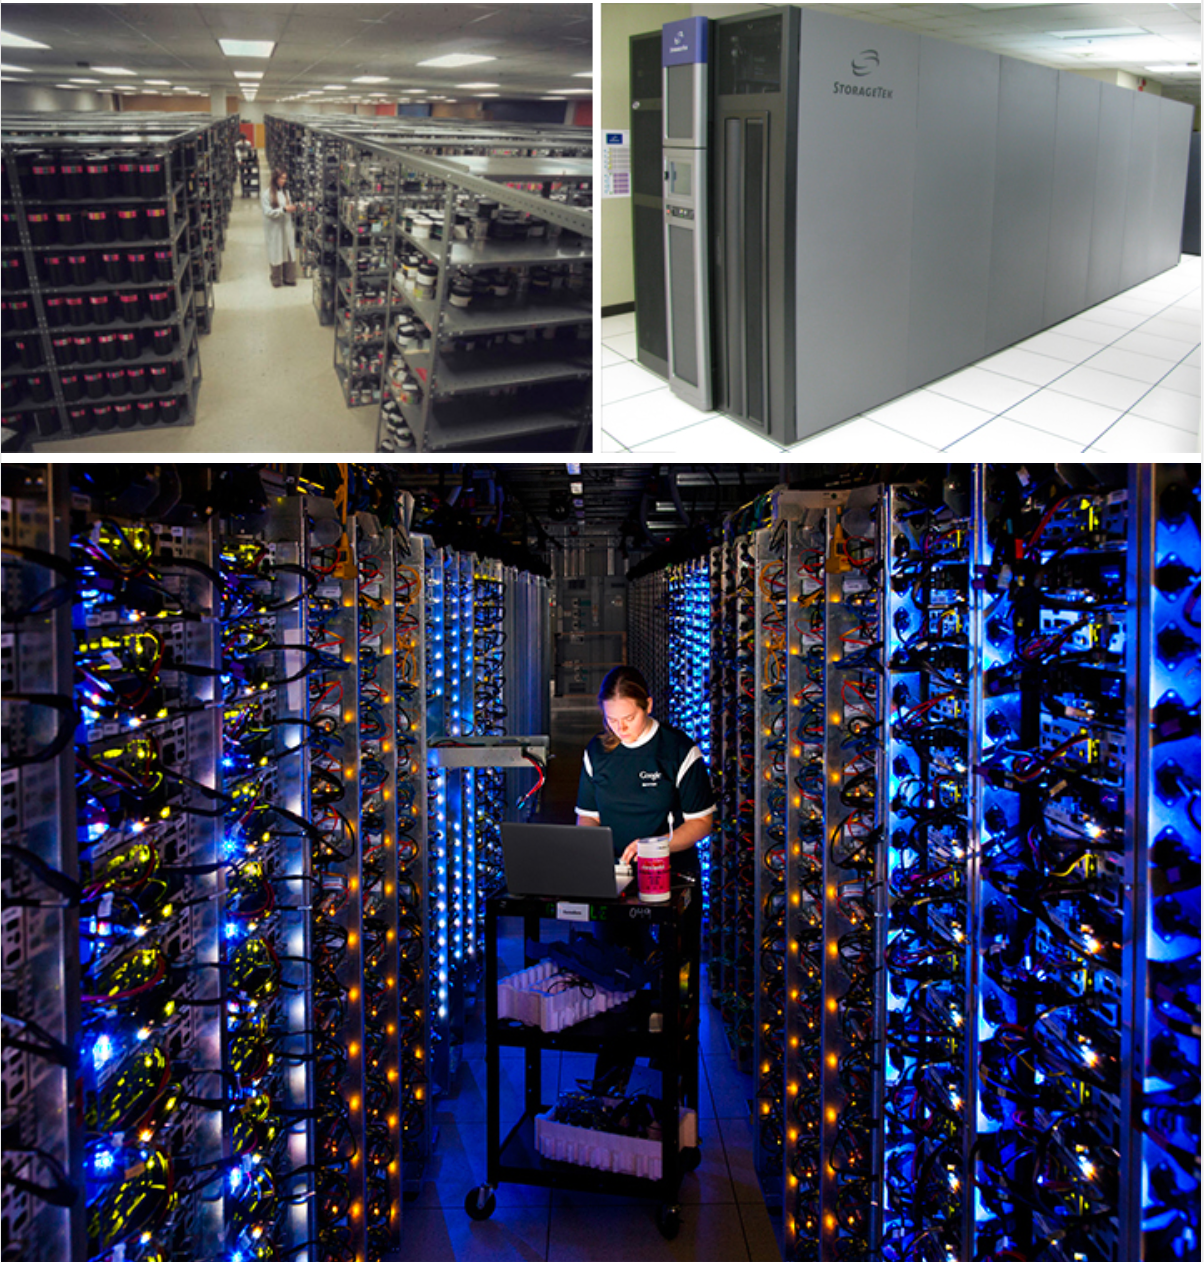
How much data? “There are roughly 400 billion land pixels in a single global mosaic,” says Rama Nemani, a scientist who runs the NASA Earth Exchange (NEX), a supercomputing collaborative at NASA’s Ames Research Center. With at least one image of every location on Earth per season every year, the entire 43-year Landsat record contains more than 50 trillion pixels.
“How could you handle that on your desktop?” asked Rebecca Moore of Google Earth Engine. “You can’t. This is where cloud computing comes in.”
It is a conclusion that some University of Maryland scientists reached over the course of two decades. Matthew Hansen and Sam Goward are geographers and remote sensing specialists who have been part of a team mapping Earth’s land cover—forests and cities, farms and water—since the mid-1990s.
“We wanted to know the impact of disturbance—harvesting, thinning, fires, storms—things that lead to changes in forests,” said Goward. “Every time you disturb a forest, it restarts the growth cycle, and when you do that, you impact the carbon cycle. Very few forests make it through a full growth cycle because of disturbances, but no one knows the patterns of forest disturbance or how they impact the carbon cycle.”
For years, Goward and Hansen worked with low-resolution data that did not have a lot of detail. But disturbance happens on a small scale, and to see it they needed something like Landsat’s 30-meter resolution. Until 2008, Landsat data were too expensive to consider a global map. “We did the science we could afford, not the science we wanted to do,” Goward said.
Then in 2008, the game started to change. “When the Landsat archive opened up, we mapped forests in Indonesia and European Russia,” Hansen said. “We then knew we could make a global map, but we didn’t have the computing power yet.”
Finally, while attending an international meeting about deforestation and forest disturbance, Hansen was introduced to Google’s Rebecca Moore. He saw an opportunity. “Their computing expertise fit perfectly with our geographic knowledge,” Hansen said. “So we ported our code for mapping forests to the Google system.”
In just a couple of days, Google applied the University of Maryland code to 700,000 Landsat scenes, discarding cloudy pixels and keeping clear pixels. It analyzed the remaining sequence of pixels and assigned a flag to each—was it forested or not? The analysis noted the date that forests were cleared or the date when they had grown-in enough to be counted as forest again. The entire process took one million hours on 10,000 central processing units (CPUs). Moore noted: “The analysis would have taken 15 years on a single computer.”
The resulting map, released in 2013, shows how Earth’s forests changed between 2000 and 2013. “It is the first global assessment of forest change in which you can see the human impact,” said Masek. And the message is: People have had a huge impact on forests.
“Less than 1 percent of old-growth forest remains in the United States,” said Hansen. But the real surprise was how quickly tropical forests are disappearing. Brazil has deservedly gotten a lot of credit for reducing their deforestation rate in the past decade, he noted, but forest cover loss has increased so much in other tropical countries that the global rate is soaring.
Such a revelation would not have been possible without the “big data” approach. “In the past, we were confounded by clouds in the tropics,” Hansen said. “Being able to mine the full Landsat archive allowed us to literally see places we haven’t seen before at this resolution. We have cloud-free data built from thousands of inputs over tropical locations like Gabon or Papua New Guinea.”
Big Data Means Bigger Questions
Apart from revealing patterns and trends in forest cover, the global forest map represents a major shift in the way Earth science is done.
“In the past, I used to bring data to my computer and analyze it,” Masek noted. But the questions have gotten bigger than that type of analysis can sustain. “Now it’s impossible to bring all the data to my computer.” Instead, scientists develop analysis tools and bring them to computation workhorses like Google Earth Engine or NEX. “We can implement our algorithms where the data live. It’s a different way of mining the Landsat archive.”
Until 2008, only 4 percent of the Landsat archive had even been examined; since the opening of the archives, the big data approach is allowing scientists to dig deeper into all of the data. This allows them to make connections they couldn’t make before.
“You can look at changes over time and you can see how one process affects another,” said Kennedy. “We are now able to ask questions about where, when, and why two processes interact.”
Kennedy has started to map biomass yearly. “We can quantify how much carbon is lost every year due to fire or clearing,” he said. And for the first time, he can ask questions like: Is the system responding differently now than it has in the past? Are we losing more carbon to fires? To insects? Are forests growing back more quickly? “We can track the full trajectory of a forest over the years.”
And the scale and scope can grow even wider. For instance, knowing how forests have changed leads to other questions about global change. “How much carbon is going into the atmosphere through forest clearing and management? How are ecosystems changing because of climate change? What are the vegetation patterns of the planet going to look like in 200 to 300 years?” Masek asked.
“Landsat gives a 40-year synopsis of what has happened, and that not only lets us see how the forests are changing now, but it could help us understand how life on Earth will change in the future.”
“We are doing statistics on the planet,” says Moore. “I’m really curious to see what people find in all of this satellite data.”
+ Read full story on NASA Earth Observatory


