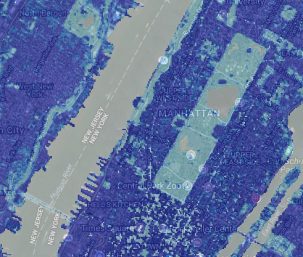
Two data products and a mapping tool recently released through the NASA Socioeconomic Data and Applications Center operated by CIESIN, provide data on man-made impervious surfaces and urban extents throughout the world, in greater detail than has been previously available.
The Human Built-up and Settlement Extent (HBASE) and Global Man-made Impervious Surface (GMIS) data sets can shed new light on patterns of urban and rural development, and help us learn more about how the growth of urban settings may impact the environment and affect the quality of life for humans and all living creatures. Such high-resolution data on urbanization can also inform critical planning and decision making for the impacts of growth, especially in the context of climate change impacts.
The term “impervious surfaces” refers to artificial surfaces that repel rainwater—for example, roads, parking lots, driveways, sidewalks, and even roofs. Very compacted terrain may also be considered impervious, for example, clay soil, and especially, soils made harder from use, such as dirt roadways.
“Settlement extent” is a term that aims to describe areas containing built structures and people, areas which in turn are often associated with increased impervious surface cover. The companion data sets GMIS and HBASE, developed by a team at the NASA Goddard Space Flight Center and University of Maryland led by Eric Brown de Colston and Chengquan Hua, are among the first data sets of their kind derived from satellite images, specifically, the 2010 Global Land Survey free Landsat archive. Launched in 1972, the Landsat program is the longest-running enterprise for the acquisition of satellite imagery of Earth.
An easy-to-use mapping tool lets users download and visualize the GMIS and HBASE data in a four-panel or full-screen view, with special features for zooming in at high-resolution and exploring various aspects of the data. This makes the data even more accessible to many types of users including researchers, urban planners and policy-makers, academics, and those modeling climate and environmental impacts of man-made surfaces, locally and throughout the world.
A brief video intro to the data sets Human Built-up and Settlement Extent (HBASE) and Global Man-made Impervious Surface (GMIS), and how to use the mapping tool to visualize the data:


