
Presentation Title
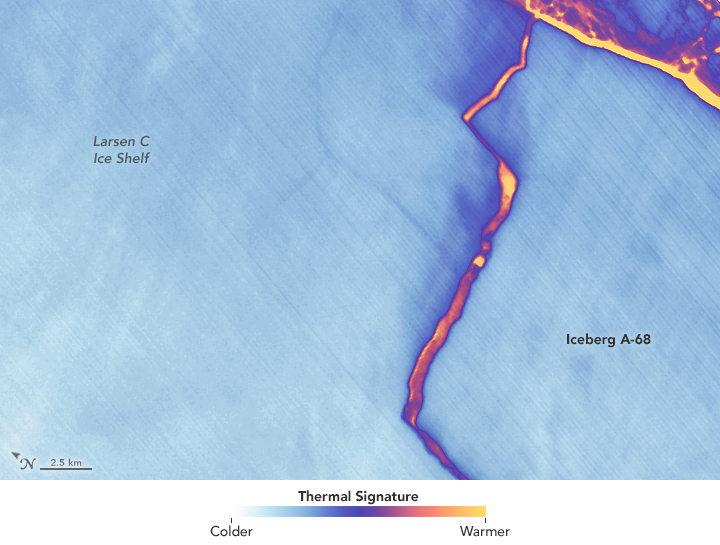
Thermal Imagery Details Larsen C Iceberg Calving
What is the significance of the calving event of iceberg A-68 from the Larsen C ice shelf?
It isn’t clear at this time. Ice shelves and the floating tongues of large outlet glaciers necessarily release icebergs as the floating ice extends forward into the surrounding ocean waters. The forces of winds, tides, and currents, as well as some thinning due to melting of the floating ice, all take their toll and break off impressive ice areas from time to time.
The National Ice Center tracks only those icebergs greater than 20 square nautical miles (~69 km2 or 26.5 mi2) but even that leads to them currently tracking 50 icebergs or fragments of originally larger icebergs around Antarctica. Larsen C has previously released an even larger iceberg, A-20, in 1986.
In effect, a calving event, even a ‘top ten’ calving event is a normal event. We do not yet know if this is a ‘precursor event’ such as when the nearby Larsen B Ice Shelf lost a large portion of its floating front in 1995, ~7 years before it largely collapsed in Feb.- Mar. 2002 as has been well documented by previous studies.
How long have researchers been using thermal data from Earth observation satellites to monitor calving events?
To my knowledge, this is the first time that thermal imagery has been extensively used to study both an advancing rift as well as the characteristics of the iceberg and its environs. In general, thermal imagery from Landsat has not been acquired without a special request during times of polar darkness but TIRS and similar data will very likely be used to study such cryospheric changes in the future. However, lower resolution thermal imagery has been widely available from both the Terra and Aqua MODIS sensors since they were launched in late 1999 and mid 2002, respectively, and from Suomi-NPP’s VIIRS instrument since late 2011.
What insight did you gain from Landsat that would have been difficult to ascertain otherwise?
One of the most important things that was achieved using the Landsat 8 sensor combination of OLI and TIRS is that their information is complimentary, providing insights not just on locations and areas of ice features, but also potentially their surface temperature and even thickness. We are still investigating the scientific value of these data but it is highly likely that the thermal channels on Landsat sensors will be used more frequently in times of polar darkness when acquisitions would otherwise be curtailed given the need for solar illumination for most sensor channels. In the past, we have observed the Pine Island Glacier’s austral winter calving events with the lower resolution MODIS thermal imagery and were were able to watch as those rifts were completed near the front of this large outlet glacier in West Antarctica and see the resulting icebergs move off into Pine Island Bay.
What was it like being on “iceberg watch” in July?
This is a difficult question to answer succinctly; it was both wonderful and terrible. It was wonderful participating in a completely spontaneous collaboration with a team of women and men from different research institutions in both the United States and in Europe, many of them named on the poster at AGU, as well as with colleagues here at Goddard; Jeff Schmaltz, Kelly Brunt, and Katherine Melocik stand out locally. The encouragement from Tom Wagner, Jim Irons, Steve Platnick, and Compton Tucker was also essential to telling this story.
But it was also terrible in that we were monitoring, essentially daily as sensor after sensor captured views of this distant part of the world, a moment of gigantic change to Earth’s cryosphere. The creation of a huge iceberg is necessarily a moment of great loss to an ice shelf. I believe this is also why this story captured the media and the public’s attention so widely, literally around the world—we were all trying to grasp the extraordinariness of this magnificently imaged event in the midst of the austral winter’s polar darkness. The intensity of the media interest left very little time to actually do research!
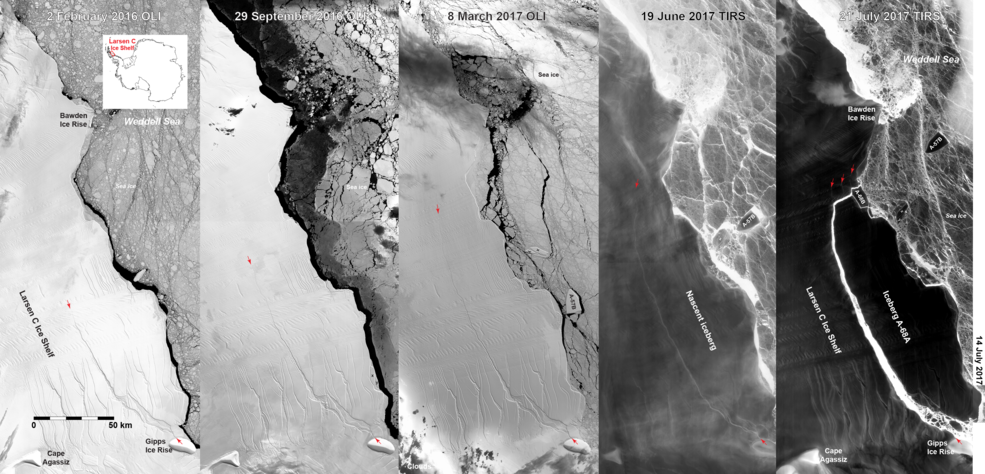
Besides responding to media requests from far and wide, one of the more amazing moments I had here at GSFC was being able to show one of the engineers of Landsat 8’s TIRS instrument, now working on TIRS-2, a two scene thermal image from June 19, 2017 where the rift was revealed almost to completion at its northern end. Even the engineers who created the sensor were impressed by the ability of TIRS to capture the thermal energy being emitted from the warmer ocean waters in the rift relative to the cold ice shelf surface, even at the narrow tip of the rift that was still forming. The final open rift on July 12th was also captured by TIRS as well as other active and passive sensors on a number of other satellites. This was also a triumph of engineering, planning, and management of global satellite resources.
Do you anticipate that Larsen C will experience calving events like that of A-20 and A-68 more often going into the future?
This is a question that is being debated (as is suggested by my answer to your first question). If the Larsen C spends the next 30+ years quietly advancing as it did, more or less, following the 1986 calving event, then there will be relatively stability and essentially no change in calving frequency; the new embayment will refill with floating glacial ice and eventually develop a new rift and a new iceberg will be released.
However, after the calving of A-68, given that the ice front of the Larsen C is now as far west as has been observed in the history of exploration in this area, there is a very real chance that the Larsen C Ice Shelf may detach from one or both of the ice rises (Bawden in the north, Gipps in the south) that currently stabilize the large remaining ice shelf area in 2017. This is why we are continuing to monitor the movements of both the ice shelf and the pieces of A-68.
Co-authors:
Christopher A. Shuman
UMBC JCET at NASA GSFC
Ted A Scambos
University of Colorado, Boulder
Jeffrey E Schmaltz
NASA Goddard Space Flight Center
Katherine A Melocik
NASA Goddard Space Flight Center
Marin J Klinger
University of Colorado, Boulder
Funding was provided by NASA Headquarters Cryospheric Science Program
Anyone can freely download Landsat data from the USGS EarthExplorer or LandsatLook.
Further Reading:
+ Landsat Spots Birth of Iceberg A-68, NASA’s Earth Observatory
+ On Iceberg Watch with Landsat’s Night-Vision
+ Landsat ‘Sees in the Dark’ the Evolution of Antarctica’s Delaware-sized Iceberg
+ Landsat at #AGU17

A Rendezvous with Landsat
NASA outreach specialists led educators through a workshop on accessing and utilizing Landsat data at the annual Earth Educators’ Rendezvous.


