
We recently had the opportunity to talk with Dr. Donal Bisanzio, a senior epidemiologist with RTI International, about the intersection of epidemiology and remote sensing. Dr. Bisanzio trained as a veterinarian—he earned both a Doctor of Veterinary Medicine and a Ph.D in Veterinary Medicine from the University of Turin—before becoming an epidemiologist.
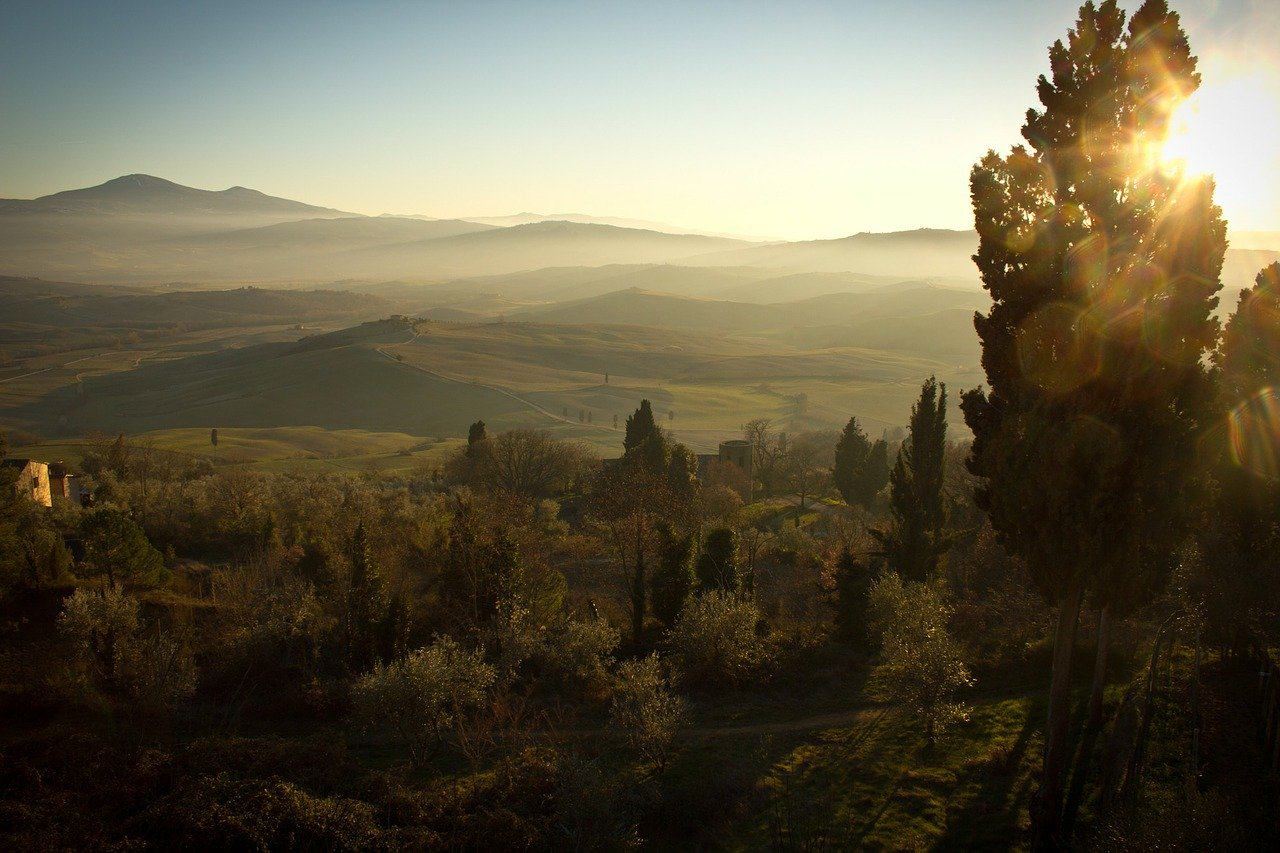
As a vet student, Dr. Bisanzio had originally planned to go into orthopedic surgery, but after joining a research team that was studying Lyme disease in a nature reserve in Tuscany he changed course. The team used a geographic information system (GIS) and NASA/USGS Landsat satellite imagery to find habitats that were favorable to the Lyme-carrying Ixode ricinus tick. Dr. Bisanzio and the epi-team headed into the field to collect ticks to confirm their satellite-based risk zone maps. Dr. Bisanzio recalls, “I was fascinated by the possibility of linking ground-level work with satellite surveys to describe the abundance of ticks and how this would impact human health.” His new course was set.
Our interview with Dr. Bisanzio follows.
What does an epidemiologist do?
The job of an epidemiologist is to study diseases and how they affect a target population (humans, animals, plants) and identify those factors linked with their transmission. The main aim of an epidemiologist is to provide solid knowledge through different methods (i.e., field survey, statistics, GIS) to help public health systems with preventing and/or reducing the burden of infectious diseases.
How does Landsat intersect with epidemiology?
Most diseases are linked with particular characteristics of the environment. For example, deciduous forests are good habitat for tick species vectors of common tick-borne diseases such as Lyme disease. Thus, it can be very important to have environmental data when study diseases. However, it is very difficult, time-consuming, and quite costly to gather habitat data at the ground level by performing field activities. This is why Landsat is a very useful tool for an epidemiologist, it provides a ‘snapshot’ of environmental factors at a particular time or multiple ‘snapshots’ during a time window.
What did your first paper on the abundance of Lyme vector in Tuscany find?
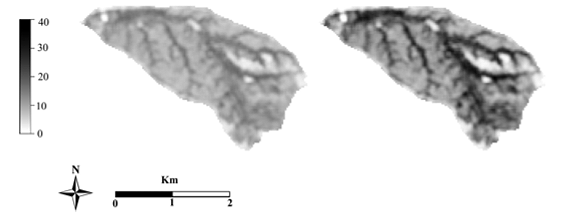
My article “Temporal variations in the usefulness of normalized difference vegetation index as a predictor for Ixodes ricinus (Acari: Ixodidae) in a Borrelia lusitaniae focus in Tuscany, central Italy.” Showed that the normalized difference vegetation index (NDVI) calculated using Landsat 7 ETM+ images were very useful for characterizing the two different type of habitats within the study area: the bottomlands and the uplands. Bottomlands, a relatively humid habitat with deciduous tree species dominating the vegetation cover, were linked to high values of NDVI. Uplands, relatively dry habitats with Mediterranean vegetation, were linked to a low value of NDVI.

We also identified that NDVI was positively linked to tick abundance in the area throughout the year. Thus, using the NDVI, I was able to create tick abundance maps for 2005 and 2006 highlighting the differences between the two years and show where the areas with a high probability of encountering a questing tick were. This was an important result since previous studies had found that 16.7% of ticks were infected with the Borrelia burgdorferi s.l. bacteria, the etiological agent of Lyme disease.
Why did you choose to work with Landsat data for that study?
We chose to use Landsat images because they had a good resolution (~30 m), they were free, and it was easy to obtain them. This was perfect for a student project which usually doesn’t have a huge amount of funding.
Does Landsat have a role to play in new interactive maps that help epidemiologist understand the spread of disease?
I think that Landsat is still a very useful tool to create an interactive tool showing the spread of disease at a high resolution. Using Landsat images, an epidemiologist can build dynamic prediction models that take into account sudden environmental changes which may increase the risk of disease spread. These types of models can be hosted on a web-GIS platform and be made freely available to public health institutions to plan their surveillance or intervention systems.
Does Landsat data ever help you predict where an ongoing epidemic will spread?
I have not yet personally used Landsat to perform such type of analyses. However, I am planning to use Landsat surveys to predict the spread of tick-borne diseases and mosquito-borne diseases in the USA and the Europe quite soon.
Would you say that epidemiologists’ use of Landsat helps people? If so, how?
I would surely say that Landsat is used by epidemiologists to help people. Using Landsat, epidemiologists can identify risk areas where people could be infected by disease agents. Using this type of information, public health institutions can make people aware of the risk and improve population health.
Does information extracted from Landsat ever help epidemiologists suggest public health interventions?
Yes, it does. Many researchers working in public health institutions produce maps using Landsat images. These maps can be used to plan surveillance and interventions. For example, Landsat images are used to plan intervention targeting mosquitoes by identifying ricefields which are perfect breeding sites.
Is free and open Landsat data important for epidemiologists?
It is very important because many countries do not have enough funding to spend on satellite images at a high resolution such as those provided by Landsat. Low- and middle-income countries benefit from having Landsat images free of charge. Adding a price to Landsat images could reduce the capacity of low-resource countries to create useful maps to plan interventions targeting emerging and non-emerging diseases.
Related reading:
+ Coronavirus Outbreak Maps Rooted in History, CityLab
+ Why Geography Is A Key Part Of Fighting The COVID-19 Coronavirus Outbreak, Forbes
Interview conducted by Laura E.P. Rocchio, NASA Landsat Communications and Public Outreach team


