
What makes mangroves so mighty?
The mangrove is making its presence known.
The ecological services that it has played for ages—protecting against storm surges and erosion, fostering creatures elemental to our food chain, purifying water, and storing away carbon—have become more widely appreciated. So, people are paying the mighty mangrove more attention.
Mangroves, like the intertidal realm they inhabit, are dynamic. They are able to rapidly colonize as their whisk broom-like roots trap sediments and build land. Yet these resilient forests are vulnerable to environmental changes like sea level fluctuations, extreme temperatures, and severe storms and mangroves’ ability to march landward with rising sea-levels is hampered by developed land. Land reclamation and aquaculture, regularly threaten mangrove forests too.
Whether or not a mangrove is protected often comes down to whether or not the long-term environmental services provided by mangroves can outweigh the immediate economics of intertidal development.
As a nation, Australia has realized that the ecological value of mangroves translates into sustained economic value. Huge tracts of mangrove forests were lost in Australia as European colonists converted them to agriculture fields and cities, but starting in the mid-1970s, a growing patchwork of international, national, and state-level legislation started to protect these protean plants from direct human harm. Today, only Brazil and Indonesia have more mangroves than Australia. Nearly 60% of all know mangrove species can be found on the Australian continent.
The myriad Australian mangroves have been largely protected from direct human destruction, but it takes active and well-informed management to protect them from environmental phenomena—that’s where the new Landsat-based mangrove migration maps come in.
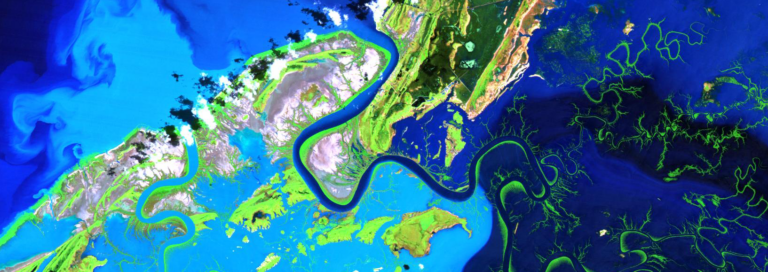
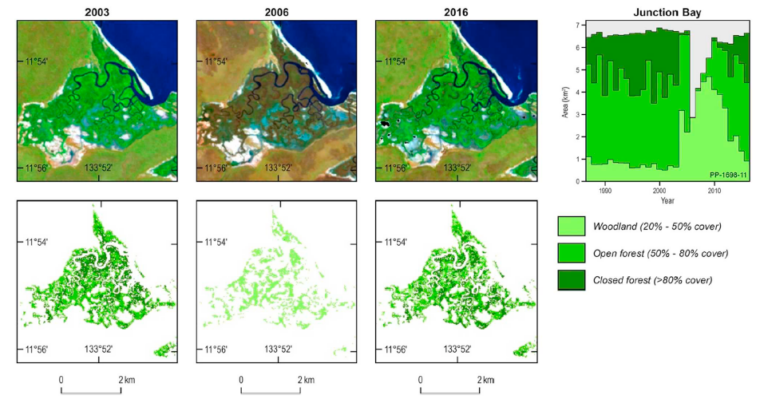
A new longitudinal study from Australia has harnessed thirty years of NASA/USGS Landsat data to map the nationwide movement and migration of mangrove forests. Using a newly developed classification technique, researchers from Australia Geoscience, have created a series of maps that show how mangrove locations have shifted year-to-year in response to storm events and a changing climate.
Australian mangroves are dispersed geographically across the nation’s long coastline—over 22,000 miles (35,900 km, not counting islands). Until this study, mapping mangroves across Australia in a nationally consistent way had been confounded by the forests’ remoteness and inaccessibility.
The decades-long Landsat data archive offered a solution. The new Landsat-based mangrove maps are nationally consistent and show the extent of Australian mangrove forests every year between 1987 and 2016. The new maps are now informing reports like the Great Barrier Reef Outlook that describe changing mangrove ecosystems and entities like the Queensland Department of Environment and Science are using the maps to better manage mangroves.
Mangroves on the Move
In 2016, a massive mangrove die-back occurred in northern Australia around the Gulf of Carpentaria where mangroves along 600 miles (1,000 km) of coast died.
The cause of that event was not immediately understood, but now it is clear that the combination of a years-long drought, high temperatures, and a sea-level decrease caused by a very strong El Niño combined into a potent mangrove killer. Additionally, this research has shown that the die-off actually started in 2014, earlier than originally recognized.
“The mangrove dieback can be seen in the data,” explains the study lead author and Landsat Science Team Member, Leo Lymburner.
Surprisingly, despite the dire 2016 environmental death-trap for northern Australian mangroves, the Landsat-derived maps reveal that mangrove forest area nationally for that year was still larger than it was in 1992 when the maps show mangrove forest extent at its lowest point in the recent past. From that 1992 minimum, mangrove forests steadily grew until peaking in 2011 with an additional 230 square miles (600 sq. km) compared to 1992.
This new study puts the massive 2016 dieback it into a broader context. Many of the mangroves that were lost during that event had recently expanded into that region—during the 1992 minimum, many of them were not there.
These mangrove victims were relatively “recent colonists” that had followed the higher sea levels to new portions of the coastline.
The study also showed that the 2016 dieback did not just affect the Gulf of Carpentaria. The declines were echoed in Western Australia’s Cambridge Gulf and the Alligator Rivers Region of the Kakadu National Park in Australia’s Northern Territory.
The new Landsat-based maps provide insights such as these around the country.
Changes in mangrove extent are cyclical and heavily influenced by sea-level and cyclones, the study found. As the climate continues to change, the magnitude of sea-level change and extreme weather will grow, having serious implications for mangroves.
Making the Maps Possible
The 2008 public release of the entire Landsat archive by USGS has made massive, long-term change studies like this one possible. This study used every image collected over Australia by Landsats 5, 7, and 8 to create its yearly maps.
Mangroves were classified using a method made possible by the data-density. Vegetation seasonality along with canopy traits were used together with previous Landsat-derived surface water maps to identify mangrove forests with high accuracy.
“The long-term acquisition plan of the Landsat mission provides a unique and invaluable dataset for tracking multi-decadal changes in the density and distribution of mangroves at continental scales,” says Lymburner. “This allows us to understand the long-term effects of sea level fluctuations and the multi-year damage and recovery cycles of mangroves affected by severe tropical cyclones.”
It’s not just Australian mangroves that can be better understood, this newly developed mangrove mapping approach could lead to improved mangrove mapping worldwide.
Anyone can view this data on Australia’s National Map website, a virtual mangrove flipbook is at your finger where you can watch mangroves forests as they expand and contract in response to local environmental conditions.
References
Lymburner, Leo, Peter Bunting, Richard Lucas, Peter Scarth, Imam Alam, Claire Phillips, Catherine Ticehurst, and Alex Held. 2019. “Mapping the multi-decadal mangrove dynamics of the Australian coastline.” Remote Sensing of Environment:111185. doi: https://doi.org/10.1016/j.rse.2019.05.004.
Rogers, Kerrylee, Paul I. Boon, Simon Branigan, Norman C. Duke, Colin D. Field, James A. Fitzsimons, Hugh Kirkman, Jock R. Mackenzie, and Neil Saintilan. 2016. “The state of legislation and policy protecting Australia’s mangrove and salt marsh and their ecosystem services.” Marine Policy 72:139-155. doi: https://doi.org/10.1016/j.marpol.2016.06.025.
Related Reading
+ 40 years of Landsat in Australia, Geoscience Australia
Article by Laura E.P. Rocchio


