Jillian Deines is a PhD candidate in Earth and Environmental Sciences at Michigan State University as well as a NASA Earth and Space Science Fellow. Today at #AGU16, she gave a talk on her work using Landsat to map croplands over the U.S. High Plains Aquifer.
Here is what she shared with us:
Presentation Title
Multi-year mapping of irrigated croplands over the US High Plains Aquifer using satellite data
What are the major findings of this research?
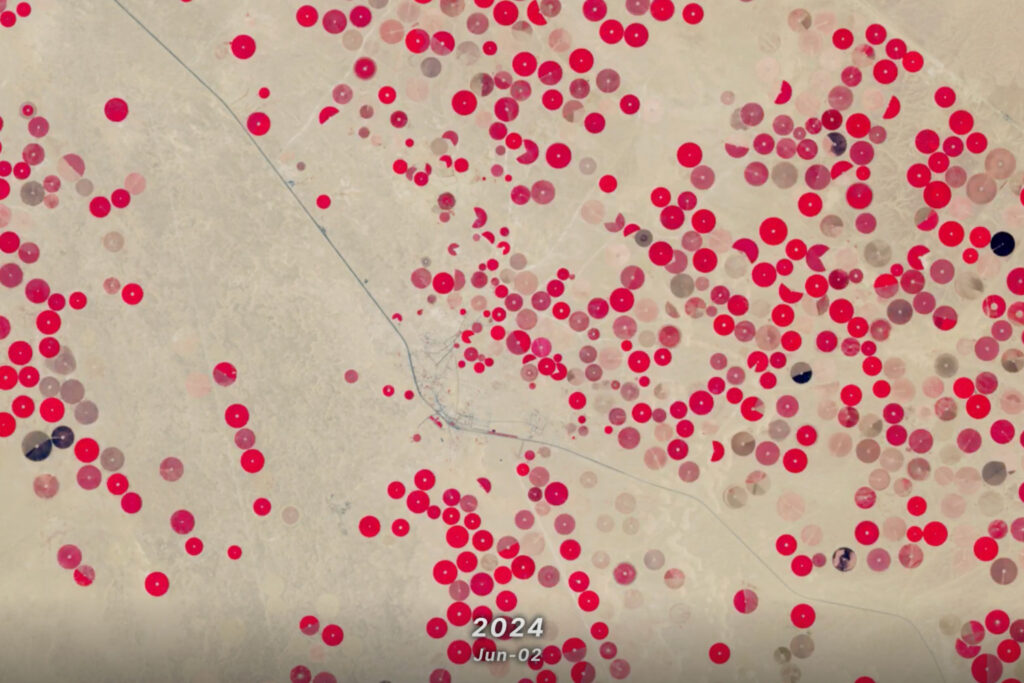
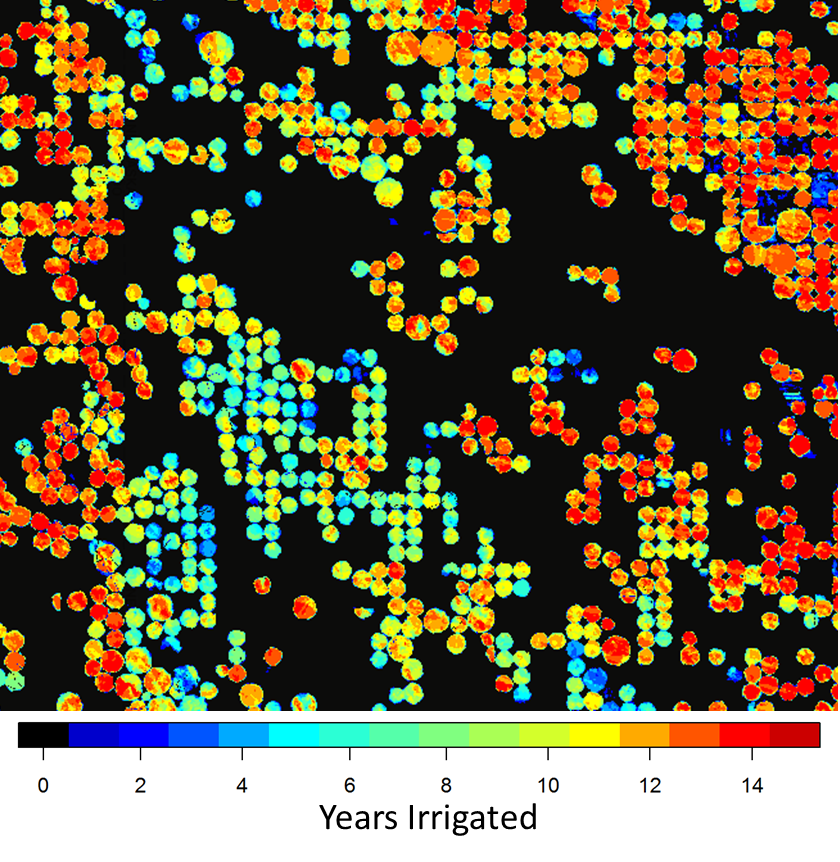
We used Landsat data to produce high resolution, annual maps of irrigated cropland in the central United States.
By analyzing this unique dataset, we found that while irrigated area has generally increased, there is considerable variability from year-to-year in total area irrigated that is related to both seasonal climate and technology advances.
For example, during the 2000’s we see an increase in irrigated area even though the total volume of groundwater used declined, indicating that farmers are able to use water more efficiently. On the other hand, during drought years, irrigated area is much reduced despite increased water use, indicating that farmers irrigate more intensely over smaller areas in order to compensate for less rainfall.
What are the implications of your findings?
Knowledge of where and when irrigation occurs is critical for effective management and hydrological modeling, yet data on patterns of irrigation through time are surprisingly rare. Our findings allow us to better understand how irrigation water needs and behavior change based on factors such as climate, technology, and increasing regulation. Understanding these relationships will help resource managers maximize crop yield, farmer profit, and water savings.
What insight did you gain from Landsat that would have been impossible to glean otherwise?
The longevity of the Landsat satellite series allowed us to use consistent methods across multiple decades. This maximizes the accuracy of our product and allows us to analyze trends across many years. With continued Landsat missions, our dataset can easily be extended as new years are acquired.
Who are the potential users of your dataset that could use it to support efforts towards groundwater sustainability?
Our research team will use this dataset to build crop-hydrology models us to compare management practices to identify strategies that lead to sustainable groundwater resources and sustainable agricultural economies. Resource managers can also use the dataset to understand irrigation dynamics within their management areas.
Co-authors:
Anthony D Kendall
Michigan State University
David W Hyndman
Michigan State University
This study was made possible by the NASA Earth and Space Science Fellowship Program, the National Science Foundation, and the USDA NIFA Water Cap Award.
Anyone can freely download Landsat data from the USGS EarthExplorer or LandsatLook.
Further Reading:
+ Landsat Abounds at #AGU16